. 2019 Feb 5:10:97.
doi: 10.3389/fimmu.2019.00097. eCollection 2019.

New Insights for RANKL as a Proinflammatory Modulator in Modeled Inflammatory Arthritis

Affiliations

New Insights for RANKL as a Proinflammatory Modulator in Modeled Inflammatory Arthritis

Maria Papadaki et al. Front Immunol. .

Abstract

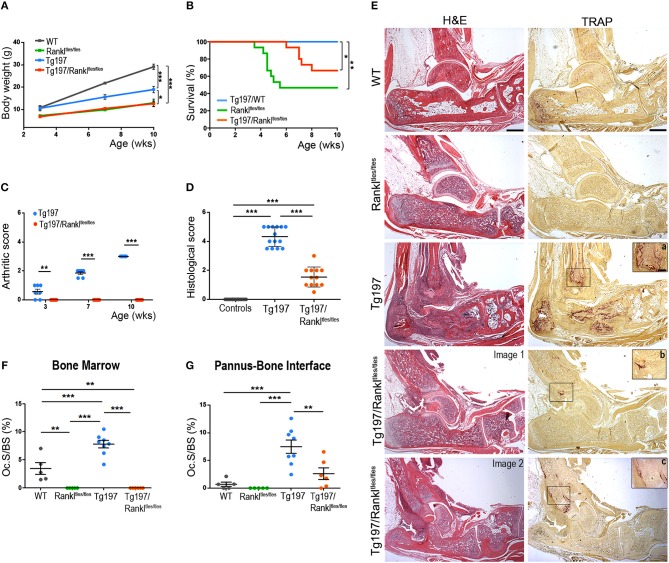
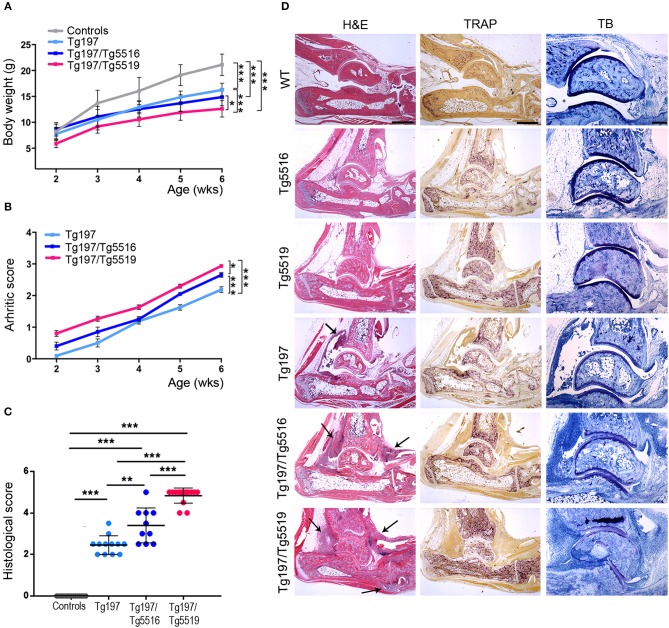
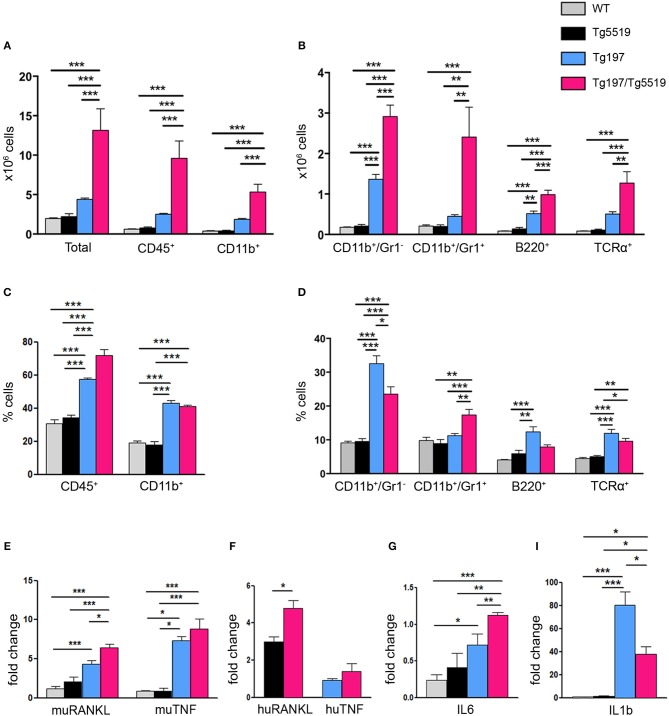
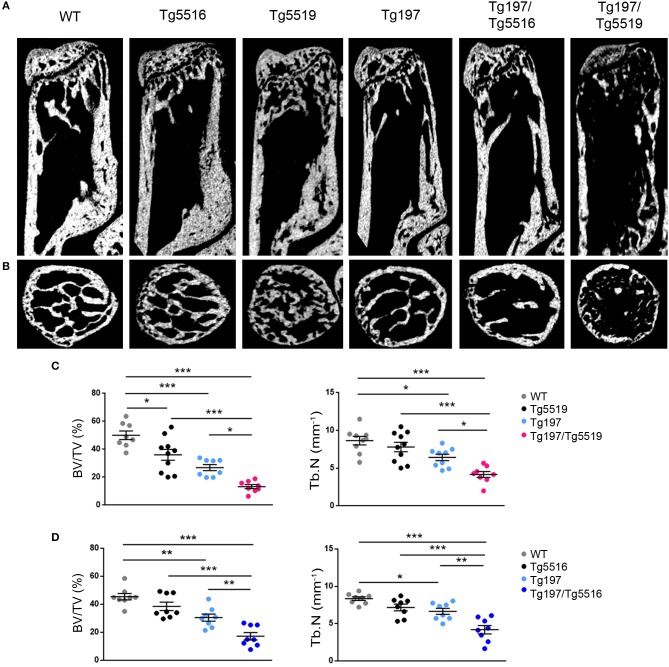
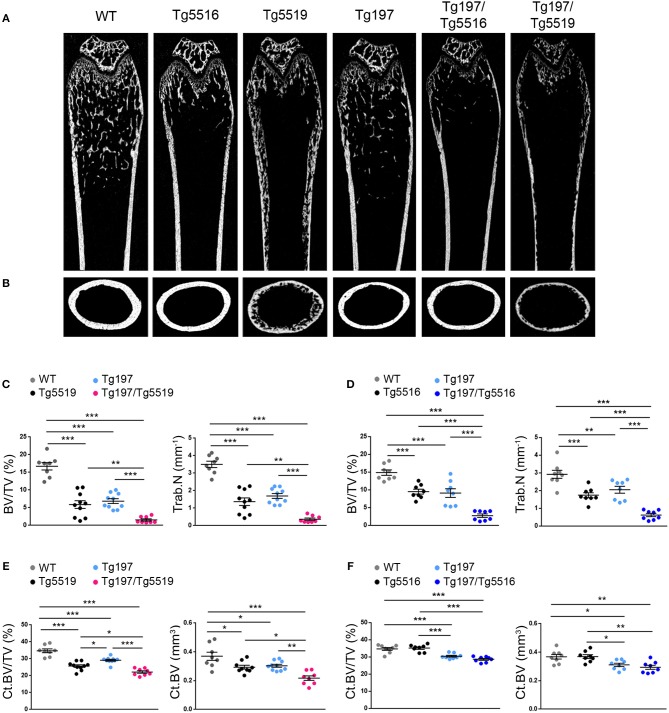
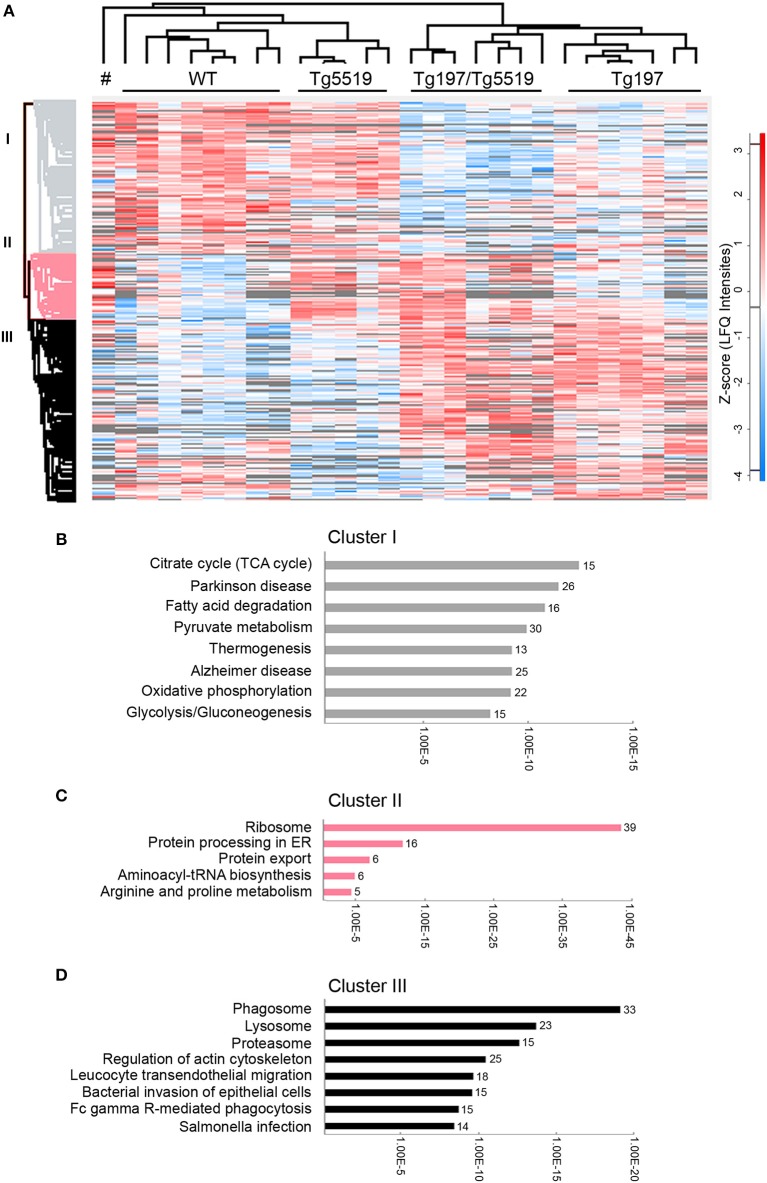
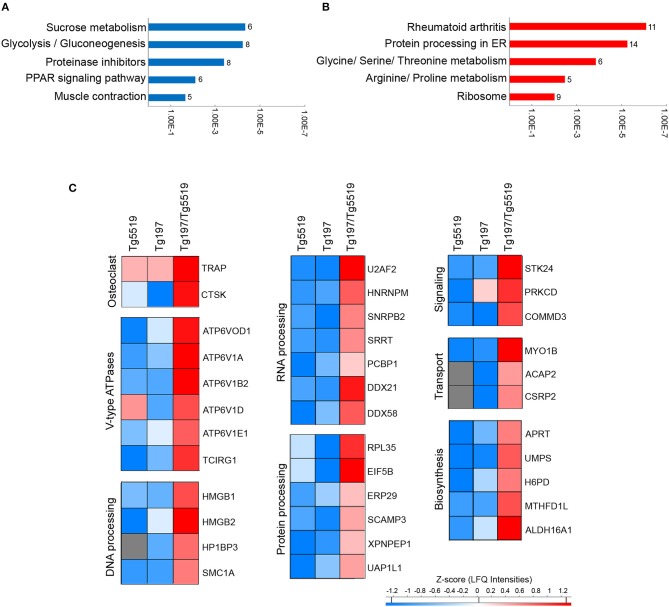
Receptor activator of nuclear factor-κB ligand (RANKL), a member of the Tumor Necrosis Factor (TNF) superfamily, constitutes the master regulator of osteoclast formation and bone resorption, whereas its involvement in inflammatory diseases remains unclear. Here, we used the human TNF transgenic mouse model of erosive inflammatory arthritis to determine if the progression of inflammation is affected by either genetic inactivation or overexpression of RANKL in transgenic mouse models. TNF-mediated inflammatory arthritis was significantly attenuated in the absence of functional RANKL. Notably, TNF overexpression could not compensate for RANKL-mediated osteopetrosis, but promoted osteoclastogenesis between the pannus and bone interface, suggesting RANKL-independent mechanisms of osteoclastogenesis in inflamed joints. On the other hand, simultaneous overexpression of RANKL and TNF in double transgenic mice accelerated disease onset and led to severe arthritis characterized by significantly elevated clinical and histological scores as shown by aggressive pannus formation, extended bone resorption, and massive accumulation of inflammatory cells, mainly of myeloid origin. RANKL and TNF cooperated not only in local bone loss identified in the inflamed calcaneous bone, but also systemically in distal femurs as shown by microCT analysis. Proteomic analysis in inflamed ankles from double transgenic mice overexpressing human TNF and RANKL showed an abundance of proteins involved in osteoclastogenesis, pro-inflammatory processes, gene expression regulation, and cell proliferation, while proteins participating in basic metabolic processes were downregulated compared to TNF and RANKL single transgenic mice. Collectively, these results suggest that RANKL modulates modeled inflammatory arthritis not only as a mediator of osteoclastogenesis and bone resorption but also as a disease modifier affecting inflammation and immune activation.

Keywords: RANKL; TNF; arthritis; inflammation; proteomics; transgenic models.


Figures

Figure 1
Figure 1
Dramatic attenuation of TNF-driven arthritis upon RANKL genetic inactivation. Tg197/Rankltles/tles mice and sex-matched control littermates WT (Rankltles/+), Tg197 (Tg197/Rankltles/+), and Rankltles/tles were assessed until the 10th week of age for (A) body weight gain (n = 6–7 per genotype), (B) percent survival (n = 15 per genotype), (C) clinical arthritic score (from 0 to 3) in both ankles for each mouse (n = 7 per genotype), and (D) histological arthritic score (from 0 to 5) in both ankles for each mouse at 10 weeks of age (n = 12–14 per genotype). Control group includes Rankltles/+ and Rankltles/tles mice. (E) Representative histological images of hematoxylin/eosin (H&E) and Tartrate-resistant acid phosphatase (TRAP) stained ankle joint sections from two Tg197/Rankltles/tles mice, displaying either mild (Image 1), or moderate inflammatory arthritis (Image 2), and their littermate controls at 10 weeks of age. Boxed areas at TRAP staining show a higher magnification of regions harboring TRAP+ cells in Tg197 (a) and Tg197/Rankltles/tles mice (b,c). Scale bars: 300 μm at H&E and TRAP, 80 μm at boxed areas in TRAP. TRAP staining was measured as osteoclast surface fraction (Oc.S/BS, %) quantification in (F) the bone marrow compartment area, and (G) the pannus-bone interface (n = 5–8 per genotype). Data represent mean values ± SEM. One-Way ANOVA and Tukey post-hoc test was performed for statistical analysis of more than two groups and Mann-Whitney test was performed for statistical analysis between two groups. The log-rank test was used for survival curve comparison. Asterisks mark statistically significant difference (*p < 0.05, **p < 0.01, ***p < 0.001).
Figure 2
Figure 2
RANKL overexpression exacerbates TNF-driven arthritis. Assessment of arthritis progression was conducted in Tg197/TgRANKL mice (Tg197/Tg5516, Tg197/Tg5519), Tg197 and sex-matched control littermates (WT, Tg5516, and Tg5519) till the 6th week of age. (A) Body weight curves (n = 10 per genotype), (B) clinical arthritic scores (n = 10–15 per genotype), (C) histological arthritic score (n = 10–15 per genotype), and (D) representative ankle joint sections from each genotype (n = 10–15) at the 6th week of age stained with hematoxylin/eosin (H&E), TRAP for osteoclasts and Toluidine Blue (TB) for articular cartilage destruction. Arrows at H&E indicate focal pannus invasion into subchondral bone regions. Scale bars: 300 μm at H&E and TRAP; 150 μm at TB. Data represent mean values ± SEM. One-Way ANOVA and Tukey post-hoc test was performed. Asterisks mark statistically significant difference (*p < 0.05, **p < 0.01, ***p < 0.001).
Figure 3
Figure 3
Increased inflammatory cell infiltration in the synovium of Tg197/TgRANKL mice. (A,B) Absolute cell counts and (C,D) percentage of synovial subpopulations from 6 week-old Tg197/Tg5519 mice and sex-matched littermates (WT, Tg5519, Tg197) as determined by flow cytometry using antibodies against CD45 (hematopoietic cells), CD11b (myeloid cells), Gr1 (granulocytes), B220 (B lymphocytes) and TCRα (T lymphocytes) (n = 4–5 per genotype). qPCR analysis in inflamed ankles from 6 week-old Tg197/Tg5519 mice and littermate controls (n = 3–4) for (E) mouse RANKL and mouse TNF, (F) human RANKL and human TNF, (G) IL6 and (I) IL1b cytokine. Data represent mean values ± SEM. One-Way ANOVA and Tukey post-hoc test was performed for more than two groups and Student's t-test for two groups. Asterisks mark statistically significant difference (*p < 0.05, **p < 0.01, ***p < 0.001).
Figure 4
Figure 4
Synergistic effect of RANKL and TNF in inflamed bone loss. MicroCT analysis in the trabecular region of the calcaneous bone from mice of each group at 6 weeks of age as shown by (A) representative longitudinal sections and (B) cross-sectional sections. Quantitative measurements with microCT in the trabecular area of the calcaneous bone for BV/TV (Bone Volume/Total Volume, %), and Tb.N (Trabecular Number per mm) in (C) Tg197/Tg5519 and littermates (n = 8–10, equal number of sexes per genotype), and (D) Tg197/Tg5516 and littermates (n = 8, equal number of sexes per genotype). Data represent mean values ± SEM. One-Way ANOVA and Tukey post-hoc test was performed for more than two groups. Asterisks mark statistically significant difference (*p < 0.05, **p < 0.01, ***p < 0.001).
Figure 5
Figure 5
Cooperative effect of RANKL and TNF in systemic bone loss. MicroCT analysis in the distal femur from mice of each genotype at 6 weeks of age as shown by (A) representative longitudinal sections and (B) cross-sectional sections at mid-diaphysis. Quantitative analysis with microCT of trabecular bone in the metaphyseal region of the distal femur of (C) Tg197/Tg5519 mice and their littermate controls (n = 8–10, equal number of sexes per genotype) and (D) Tg197/Tg5516 mice and their littermate controls (n = 8, equal number of sexes per genotype) for BV/TV (Bone Volume/Total Volume, %), and Tb.N (Trabecular Number per mm). Quantitative analysis with microCT of cortical bone in the mid-diaphyseal region of the femur of (E) Tg197/Tg5519 mice compared to their littermate controls (n = 8–10, equal number of sexes per genotype), and (F) Tg197/Tg5516 and their littermates (n = 8, equal number of sexes per genotype) for Ct.BV/TV (Cortical Bone Volume/Total Volume, %), and Ct. BV (Cortical Bone Volume, mm3). Data represent mean values ± SEM. One-Way ANOVA and Tukey post-hoc test was performed for more than two groups. Asterisks mark statistically significant difference (*p < 0.05, **p < 0.01, ***p < 0.001).
Figure 6
Figure 6
Proteomic analysis in inflamed ankle joints of Tg197/TgRANKL mice. Comparative proteomic analysis using LC-MS/MS and label free quantitation in ankles from 6 week-old Tg197/Tg5519 mice and control groups including Tg197, Tg5519, and WT littermate mice (n = 6–8 biological replicas). (A) Heat map of statistical significant proteins (one-way ANOVA analysis). Columns represent each individual sample, labeled on top, and each row represents single proteins with an assigned color from blue (low expression) to red (high expression). Not detectable proteins are colored gray. Hierarchical Euclidean clustering created 3 protein clusters (gray, pink, and black). # indicates one Tg5519 mouse. Annotation enrichment analysis was performed using KEGG pathways database for (B) cluster I, (C) cluster II, and (D) cluster III.
Figure 7
Figure 7
Identification of upregulated proteins in the inflamed ankles of Tg197/TgRANKL mice. Enrichment annotation analysis based on KEGG database for (A) downregulated and (B) upregulated proteins in Tg197/Tg5519 compared to Tg197 mice. Bars represent the –Log(p-value) of pathways and the associated number of genes is presented at the end of the bar. (C) Abundance heat maps for proteins upregulated in Tg197/Tg5519 mice compared to Tg197 and Tg5519 control mice (Tukey's analysis). The average abundance of biological replicas (n = 6–8) is represented in each cell of the heat map.

Similar articles

Cited by

References

    1. Fuller K, Wong B, Fox S, Choi Y, Chambers TJ. TRANCE is necessary and sufficient for osteoblast-mediated activation of bone resorption in osteoclasts. J Exp Med. (1998) 188:997–1001. 10.1084/jem.188.5.997 - DOI - PMC - PubMed
    1. Lacey DL, Timms E, Tan HL, Kelley MJ, Dunstan CR, Burgess T, et al. . Osteoprotegerin ligand is a cytokine that regulates osteoclast differentiation and activation. Cell (1998) 93:165–76. 10.1016/S0092-8674(00)81569-X - DOI - PubMed
    1. Yasuda H, Shima N, Nakagawa N, Yamaguchi K, Kinosaki M, Mochizuki S, et al. . Osteoclast differentiation factor is a ligand for osteoprotegerin/osteoclastogenesis-inhibitory factor and is identical to TRANCE/RANKL. Proc Natl Acad Sci USA. (1998) 95:3597–602. 10.1073/pnas.95.7.3597 - DOI - PMC - PubMed
    1. Seeman E, Delmas PD. Bone quality–the material and structural basis of bone strength and fragility. N Engl J Med. (2006) 354:2250–61. 10.1056/NEJMra053077 - DOI - PubMed
    1. Kong YY, Yoshida H, Sarosi I, Tan HL, Timms E, Capparelli C, et al. . OPGL is a key regulator of osteoclastogenesis, lymphocyte development and lymph-node organogenesis. Nature (1999) 397:315–23. 10.1038/16852 - DOI - PubMed

Publication types