

Integrative Analysis of Transcriptome and GWAS Data to Identify the Hub Genes Associated With Milk Yield Trait in Buffalo
- PMID: 30804981
- PMCID: PMC6371051
- DOI: 10.3389/fgene.2019.00036
Integrative Analysis of Transcriptome and GWAS Data to Identify the Hub Genes Associated With Milk Yield Trait in Buffalo
Abstract
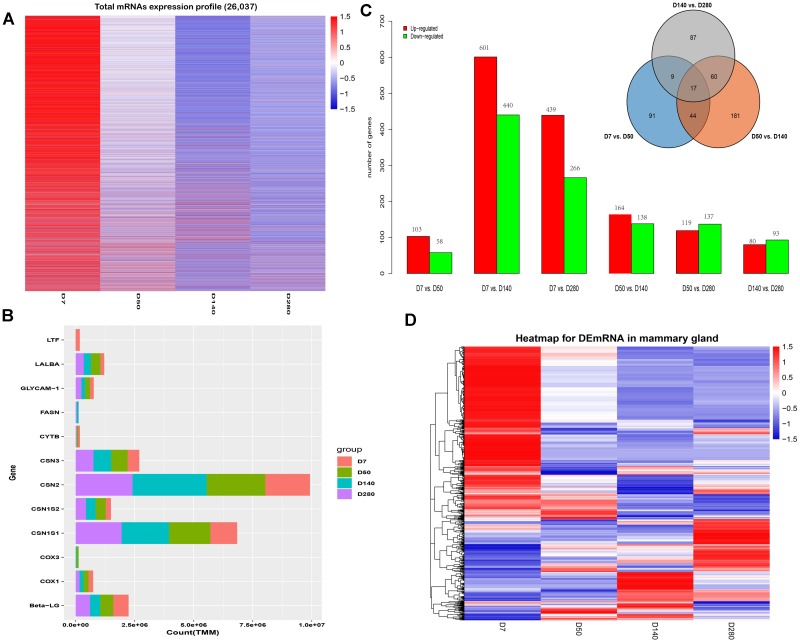
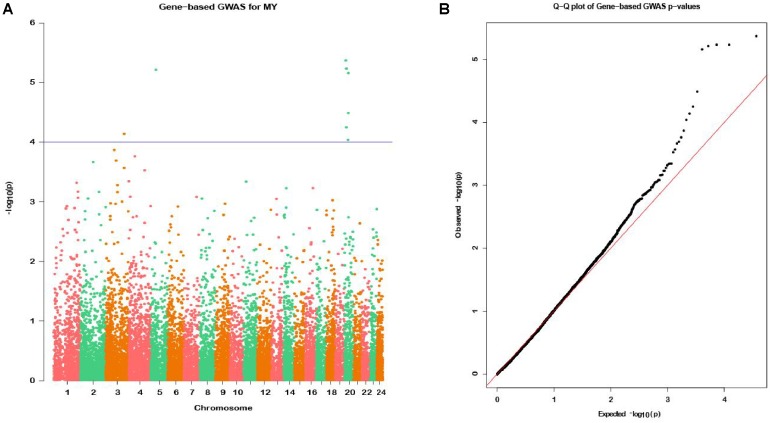
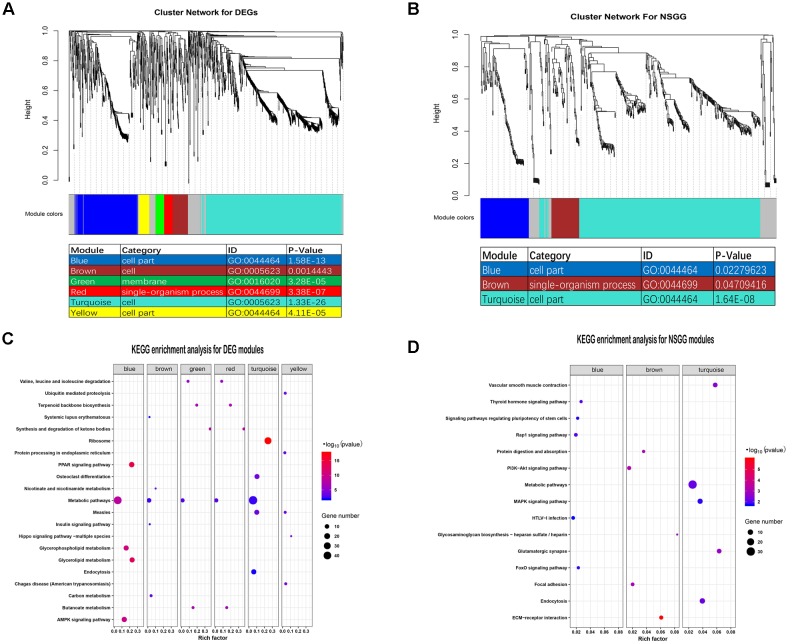
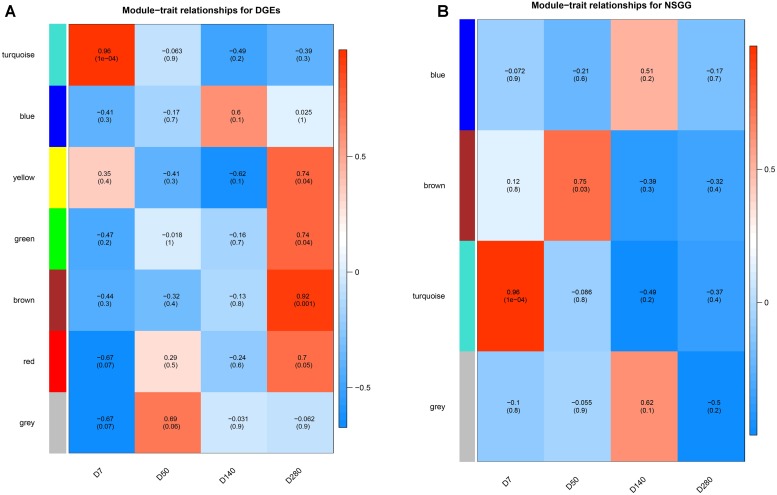
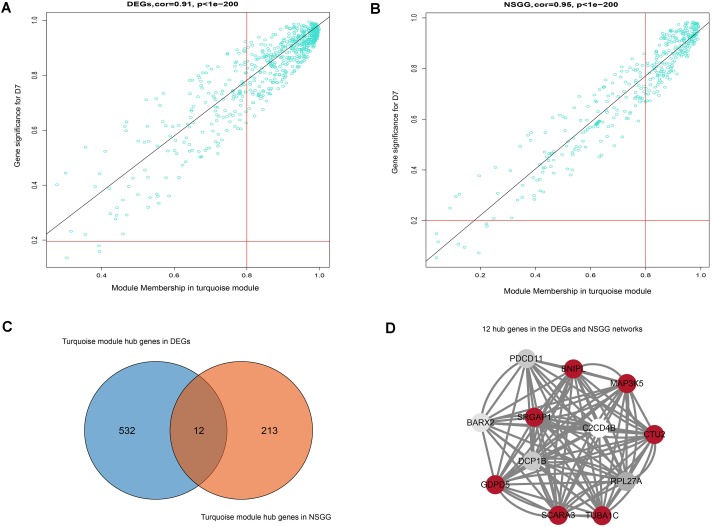
The mammary gland is the production organ in mammals that is of great importance for milk production and quality. However, characterization of the buffalo mammary gland transcriptome and identification of the valuable candidate genes that affect milk production is limited. Here, we performed the differential expressed genes (DEGs) analysis of mammary gland tissue on day 7, 50, 140, and 280 after calving and conducted gene-based genome-wide association studies (GWAS) of milk yield in 935 Mediterranean buffaloes. We then employed weighted gene co-expression network analysis (WGCNA) to identify specific modules and hub genes related to milk yield based on gene expression profiles and GWAS data. The results of the DEGs analysis showed that a total of 1,420 DEGs were detected across different lactation points. In the gene-based analysis, 976 genes were found to have genome-wide association (P ≤ 0.05) that could be defined as the nominally significant GWAS geneset (NSGG), 9 of which were suggestively associated with milk yield (P < 10-4). Using the WGCNA analysis, 544 and 225 genes associated with milk yield in the turquoise module were identified from DEGs and NSGG datasets, respectively. Several genes (including BNIPL, TUBA1C, C2CD4B, DCP1B, MAP3K5, PDCD11, SRGAP1, GDPD5, BARX2, SCARA3, CTU2, and RPL27A) were identified and considered as the hub genes because they were involved in multiple pathways related to milk production. Our findings provide an insight into the dynamic characterization of the buffalo mammary gland transcriptome, and these potential candidate genes may be valuable for future functional characterization of the buffalo mammary gland.
Keywords: RNA-seq; WGCNA; buffalo; genome-wide association studies; hub genes; milk yield.
Figures
Similar articles
-
Genome-wide association studies to identify quantitative trait loci affecting milk production traits in water buffalo.J Dairy Sci. 2018 Jan;101(1):433-444. doi: 10.3168/jds.2017-13246. Epub 2017 Nov 8. J Dairy Sci. 2018. PMID: 29128211
-
Co-Expression Network and Pathway Analyses Reveal Important Modules of miRNAs Regulating Milk Yield and Component Traits.Int J Mol Sci. 2017 Jul 18;18(7):1560. doi: 10.3390/ijms18071560. Int J Mol Sci. 2017. PMID: 28718798 Free PMC article.
-
Identifying Hub Genes for Heat Tolerance in Water Buffalo (Bubalus bubalis) Using Transcriptome Data.Front Genet. 2019 Mar 13;10:209. doi: 10.3389/fgene.2019.00209. eCollection 2019. Front Genet. 2019. PMID: 30918514 Free PMC article.
-
Systematic analyses for candidate genes of milk production traits in water buffalo (Bubalus Bubalis).Anim Genet. 2019 Jun;50(3):207-216. doi: 10.1111/age.12739. Epub 2019 Apr 1. Anim Genet. 2019. PMID: 30937948 Review.
-
Identification and analysis of the expression of microRNA from lactating and nonlactating mammary glands of the Chinese swamp buffalo.J Dairy Sci. 2017 Mar;100(3):1971-1986. doi: 10.3168/jds.2016-11461. Epub 2017 Jan 18. J Dairy Sci. 2017. PMID: 28109598 Review.
Cited by
-
De Novo Transcriptome Dataset Generation of the Swamp Buffalo Brain and Non-Brain Tissues.Biomed Res Int. 2022 Oct 12;2022:4472940. doi: 10.1155/2022/4472940. eCollection 2022. Biomed Res Int. 2022. PMID: 36408285 Free PMC article.
-
Identifying key genes in milk fat metabolism by weighted gene co-expression network analysis.Sci Rep. 2022 Apr 27;12(1):6836. doi: 10.1038/s41598-022-10435-1. Sci Rep. 2022. PMID: 35477736 Free PMC article.
-
Improved biomarker discovery through a plot twist in transcriptomic data analysis.BMC Biol. 2022 Sep 24;20(1):208. doi: 10.1186/s12915-022-01398-w. BMC Biol. 2022. PMID: 36153614 Free PMC article.
-
The Candidate Chromosomal Regions Responsible for Milk Yield of Cow: A GWAS Meta-Analysis.Animals (Basel). 2022 Feb 25;12(5):582. doi: 10.3390/ani12050582. Animals (Basel). 2022. PMID: 35268150 Free PMC article.
-
Genome-wide study for signatures of selection identifies genomic regions and candidate genes associated with milk traits in sheep.Mamm Genome. 2025 Mar;36(1):140-150. doi: 10.1007/s00335-025-10107-1. Epub 2025 Feb 4. Mamm Genome. 2025. PMID: 39904907
References
LinkOut - more resources
Full Text Sources
Miscellaneous