

A Computer Simulation Model to Analyze the Application Process for Competitive Residency Programs
- PMID: 30805093
- PMCID: PMC6375320
- DOI: 10.4300/JGME-D-18-00397.1
A Computer Simulation Model to Analyze the Application Process for Competitive Residency Programs
Abstract
Background: The residency match process for competitive specialties hinders programs' ability to holistically review applications.
Objective: A computer simulation model of the residency application process was created to test the hypotheses that (1) it is advantageous to medical students to apply to the maximum number of programs under the current system, and (2) including a medical student's residency program preferences at the beginning of the application process improves the efficiency of the system for applicants and programs as quantified by the number of interview invitations received.
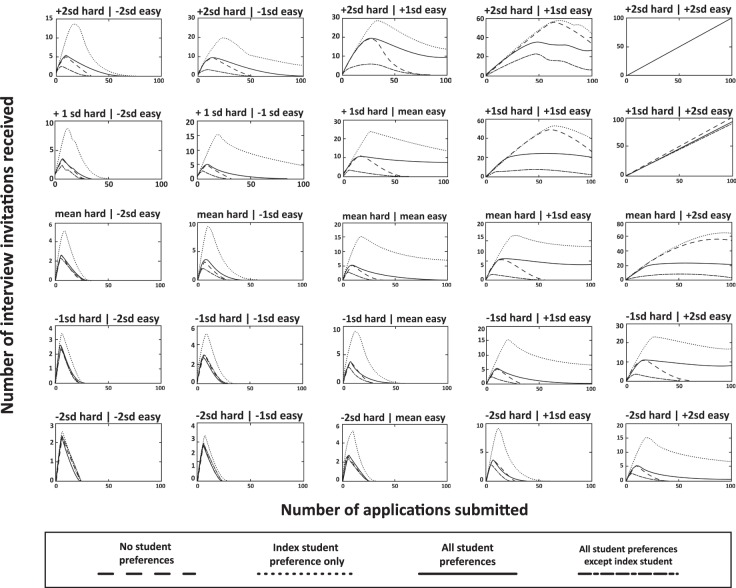
Methods: The study was conducted in 2016 using 2014 Otolaryngology Match data. A computer model was created to perform simulations for multiple scenarios to test the hypotheses. Students were assigned scores representing easy and hard metrics and program preferences, simulating a mixture of individual student preference and general program popularity.
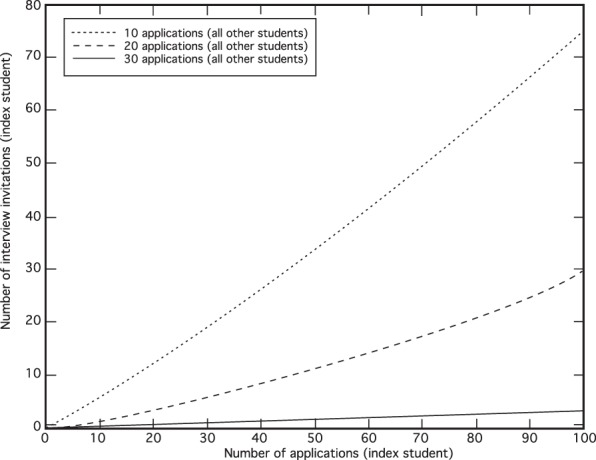
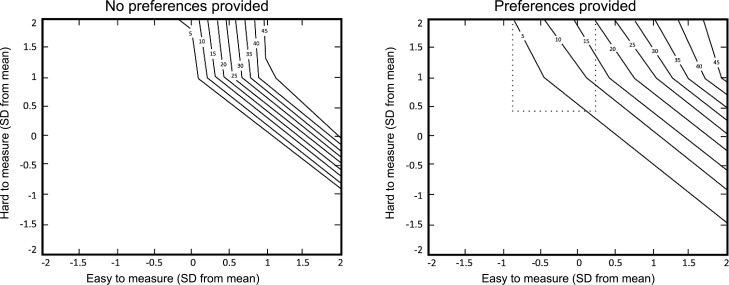
Results: We modeled a system of 99 otolaryngology residency programs with 292 residency spots and 460 student applicants. While it was individually advantageous for an applicant to apply to the maximum number of programs, this led to a poor result for the majority of students when all applicants undertook the strategy. The number of interview invitations improved for most applicants when preference was revealed.
Conclusions: Offering applicants an option to provide program preference improves the practical number of interview invitations. This enables programs to review applicants holistically-instead of using single parameters such as United States Medical Licensing Examination scores-which facilitates a selection of applicants who will be successful in residency.
Conflict of interest statement
Conflict of interest: The authors declare they have no competing interests.
Figures
Comment in
-
Disruptive Innovation and the Residency Match: The Time Is Now.J Grad Med Educ. 2019 Feb;11(1):36-38. doi: 10.4300/JGME-D-18-01091. J Grad Med Educ. 2019. PMID: 30805094 Free PMC article. No abstract available.
-
May the Interview Be With You: Signal Your Preferences.J Grad Med Educ. 2019 Feb;11(1):39-40. doi: 10.4300/JGME-D-19-00002.1. J Grad Med Educ. 2019. PMID: 30805095 Free PMC article. No abstract available.
-
A Solution Worth Trying: Providing Program Preference in Residency Applications.J Grad Med Educ. 2019 Feb;11(1):41-43. doi: 10.4300/JGME-D-18-01092.1. J Grad Med Educ. 2019. PMID: 30805096 Free PMC article. No abstract available.
-
Preference Signaling for Competitive Residency Programs in the NRMP.J Grad Med Educ. 2019 Dec;11(6):733-734. doi: 10.4300/JGME-D-19-00695.1. J Grad Med Educ. 2019. PMID: 31871581 Free PMC article. No abstract available.
References
-
- Gale D, Shapley LS. College admissions and the stability of marriage. Am Math Mon. 1962;69(1):9–15. doi: 10.2307/2312726. - DOI
-
- Warrick SS, Crumrine RS. Predictors of success in an anesthesiology residency. Acad Med. 1986;61(7):591–595. - PubMed
-
- Egol KA, Collins J, Zuckerman JD. Success in orthopaedic training: resident selection and predictors of quality performance. J Am Acad Orthop Surg. 2011;19(2):72–80. - PubMed
MeSH terms
LinkOut - more resources
Full Text Sources
