

Diverse microbial communities hosted by the model carnivorous pitcher plant Sarracenia purpurea: analysis of both bacterial and eukaryotic composition across distinct host plant populations
- PMID: 30805246
- PMCID: PMC6383556
- DOI: 10.7717/peerj.6392
Diverse microbial communities hosted by the model carnivorous pitcher plant Sarracenia purpurea: analysis of both bacterial and eukaryotic composition across distinct host plant populations
Abstract
Background: The pitcher plant Sarracenia purpurea supplements nutrient acquisition through carnivory, capturing insect prey which are digested by a food web community of eukaryotes and bacteria. While the food web invertebrates are well studied, and some recent studies have characterized bacteria, detailed genetic analysis of eukaryotic diversity is lacking. This study aimed to compare eukaryotic and bacterial composition and diversity of pitcher communities within and between populations of host plants in nearby but distinct wetland habitats, and to characterize microbial functions across populations and in comparison with another freshwater community.
Methods: Pitcher fluid was sampled from the two wetlands, Cedarburg and Sapa Bogs, community DNA was extracted, and 16S and 18S rRNA amplicons were sequenced and data processed for community-level comparisons.
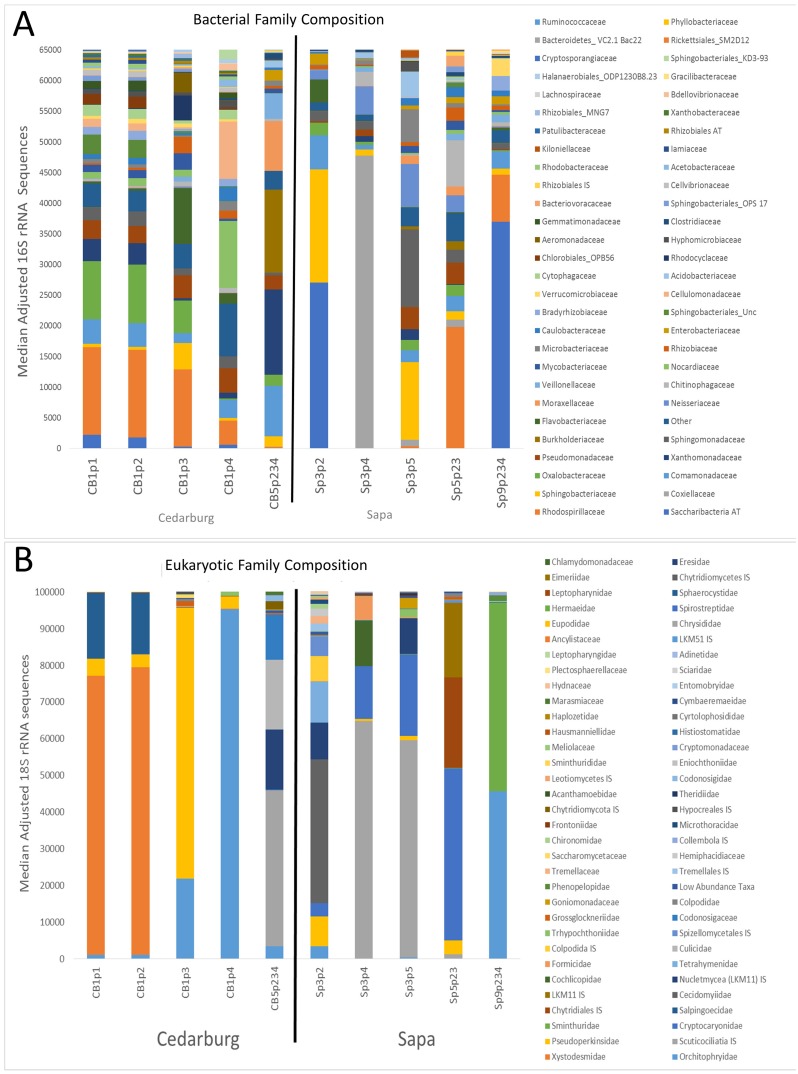
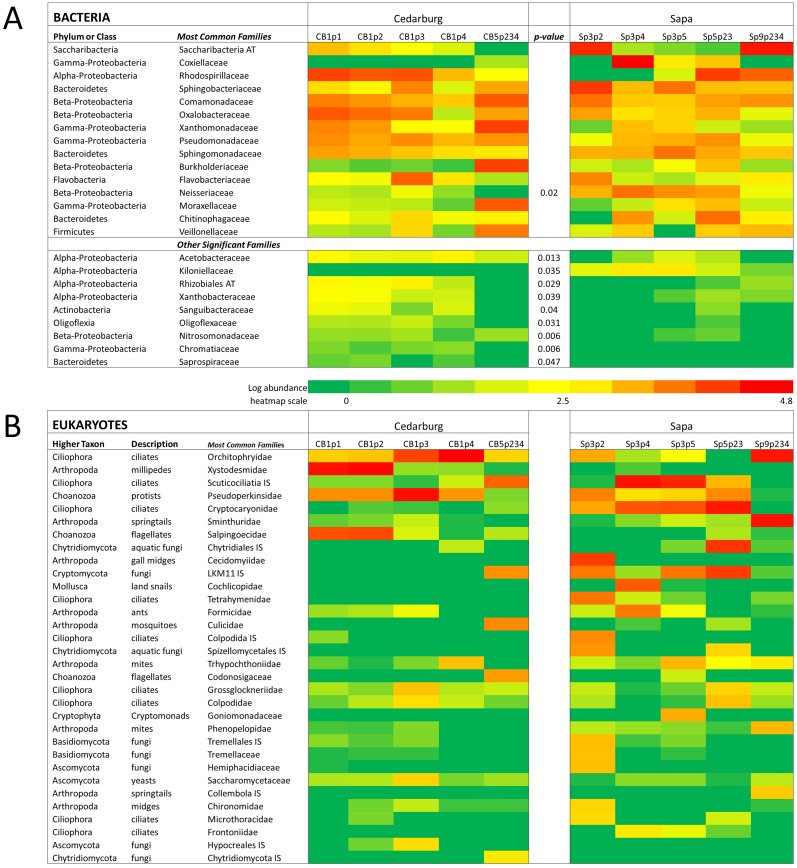
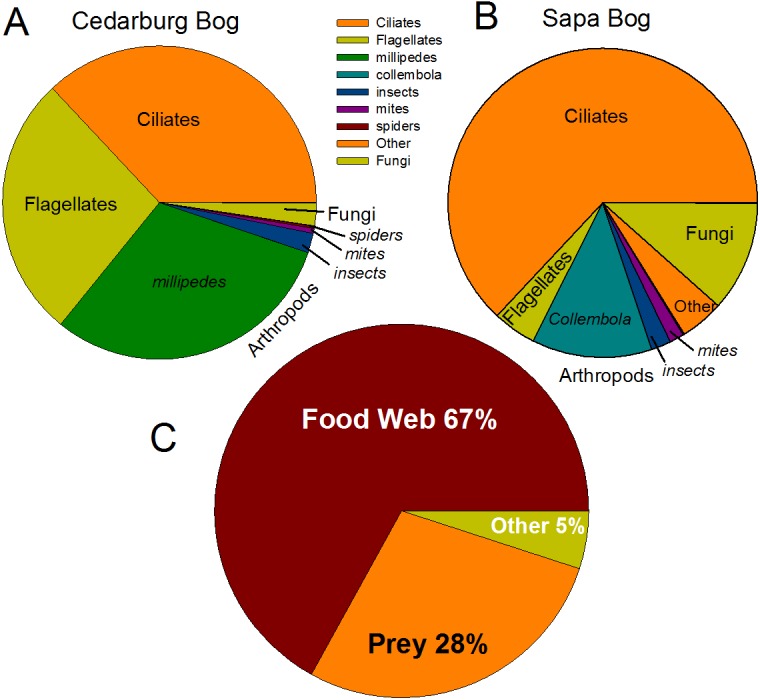
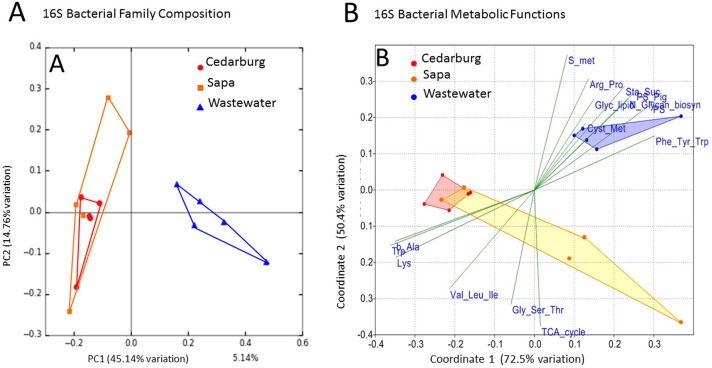
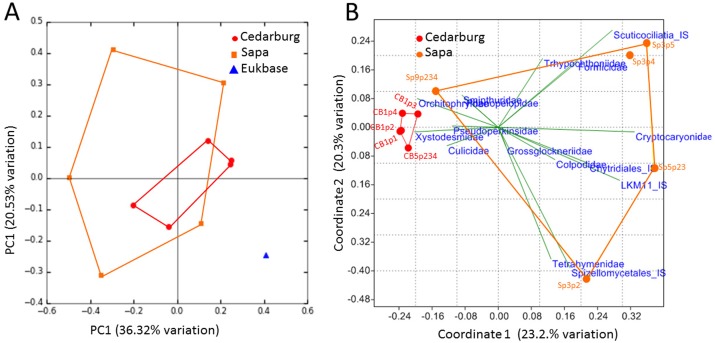
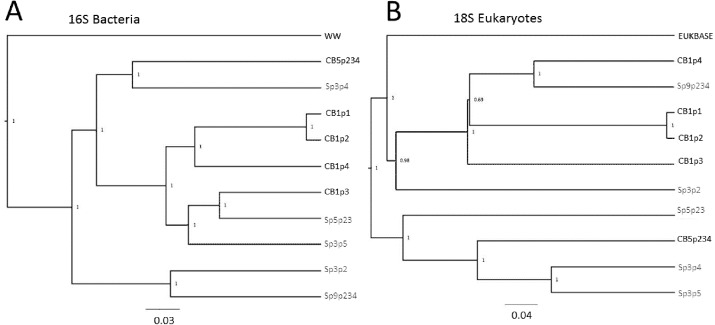
Results and conclusions: Bacterial diversity in the small pitcher volume rivaled that of larger aquatic communities. Between pitcher plant populations, several bacterial families (Kiloniellaceae, Acetobacteraceae, Xanthobacteraceae, Sanguibacteraceae, Oligoflexaceae, Nitrosomonadaceae, Chromatiaceae, Saprospiraceae) were significantly higher in one population. However, although predicted pitcher bacterial functions were distinct from other freshwater communities, especially for some amino acid metabolism, functions were similar across all the pitchers in the two populations. This suggests some functional redundancy among bacterial taxa, and that functions converge to achieve similar food web processes. The sequencing identified a previously under-appreciated high diversity of ciliates, Acari mites, fungi and flagellates in pitcher communities; the most abundant sequences from eukaryotic taxa were Oligohymenophorea ciliates, millipedes and Ichthyosporea flagellates. Two thirds of taxa were identified as food web inhabitants and less than one third as prey organisms. Although eukaryotic composition was not significantly different between populations, there were different species of core taxonomic groups present in different pitchers-these differences may be driven by wetland habitats providing different populations to colonize new pitchers. Eukaryotic composition was more variable than bacterial composition, and there was a poor relationship between bacterial and eukaryotic composition within individual pitchers, suggesting that colonization by eukaryotes may be more stochastic than for bacteria, and bacterial recruitment to pitchers may involve factors other than prey capture and colonization by eukaryotic food web inhabitants.
Keywords: Acari; Bacteria; Carnivorous plant; Ciliate; Eukaryotes; Fungi; Microbial diversity; Microbiome; Nutrient transformation; Wetland plant.
Conflict of interest statement
The authors declare there are no competing interests.
Figures
Similar articles
-
Bacterial Recruitment to Carnivorous Pitcher Plant Communities: Identifying Sources Influencing Plant Microbiome Composition and Function.Front Microbiol. 2022 Mar 14;13:791079. doi: 10.3389/fmicb.2022.791079. eCollection 2022. Front Microbiol. 2022. PMID: 35359741 Free PMC article.
-
Selective Bacterial Community Enrichment between the Pitcher Plants Sarracenia minor and Sarracenia flava.Microbiol Spectr. 2021 Dec 22;9(3):e0069621. doi: 10.1128/Spectrum.00696-21. Epub 2021 Nov 24. Microbiol Spectr. 2021. PMID: 34817222 Free PMC article.
-
Bacterial diversity in three distinct sub-habitats within the pitchers of the northern pitcher plant, Sarracenia purpurea.FEMS Microbiol Ecol. 2012 Mar;79(3):555-67. doi: 10.1111/j.1574-6941.2011.01240.x. Epub 2011 Nov 21. FEMS Microbiol Ecol. 2012. PMID: 22092381
-
Traps of carnivorous pitcher plants as a habitat: composition of the fluid, biodiversity and mutualistic activities.Ann Bot. 2011 Feb;107(2):181-94. doi: 10.1093/aob/mcq238. Epub 2010 Dec 15. Ann Bot. 2011. PMID: 21159782 Free PMC article. Review.
-
Carnivorous pitcher plants: insights in an old topic.Phytochemistry. 2011 Sep;72(13):1678-82. doi: 10.1016/j.phytochem.2010.11.024. Epub 2010 Dec 22. Phytochemistry. 2011. PMID: 21185041 Review.
Cited by
-
Bacterial Recruitment to Carnivorous Pitcher Plant Communities: Identifying Sources Influencing Plant Microbiome Composition and Function.Front Microbiol. 2022 Mar 14;13:791079. doi: 10.3389/fmicb.2022.791079. eCollection 2022. Front Microbiol. 2022. PMID: 35359741 Free PMC article.
-
Characterization and Comparison of Convergence Among Cephalotus follicularis Pitcher Plant-Associated Communities With Those of Nepenthes and Sarracenia Found Worldwide.Front Plant Sci. 2022 Jun 6;13:887635. doi: 10.3389/fpls.2022.887635. eCollection 2022. Front Plant Sci. 2022. PMID: 35734258 Free PMC article.
-
Metabarcoding of the phytotelmata of Pseudalcantarea grandis (Bromeliaceae) from an arid zone.PeerJ. 2022 Jan 27;10:e12706. doi: 10.7717/peerj.12706. eCollection 2022. PeerJ. 2022. PMID: 35127281 Free PMC article.
-
Illuminating protist diversity in pitcher plants and bromeliad tanks.PLoS One. 2022 Jul 27;17(7):e0270913. doi: 10.1371/journal.pone.0270913. eCollection 2022. PLoS One. 2022. PMID: 35895712 Free PMC article.
-
Ichthyosporea: a window into the origin of animals.Commun Biol. 2024 Jul 29;7(1):915. doi: 10.1038/s42003-024-06608-5. Commun Biol. 2024. PMID: 39075159 Free PMC article. Review.
References
-
- Abubucker S, Segata N, Goll J, Schubert AM, Izard J, Cantarel BL, Rodriguez-mueller B, Zucker J, Thiagarajan M, Schloss PD, Gevers D, Henrissat B, White O, Kelley ST, Methe B, Mitreva M, Huttenhower C. Metabolic reconstruction for metagenomic data and its application to the human microbiome. PLOS Computational Biology. 2012;8:1–17. doi: 10.1371/journal.pcbi.1002358. - DOI - PMC - PubMed
-
- Aronesty E. Command-line tools for processing biological sequencing data. 2011. https://expressionanalysis.github.io/ea-utils/ https://expressionanalysis.github.io/ea-utils/
-
- Baiser B, Buckley HL, Gotelli NJ, Ellison AM. Predicting food-web structure with metacommunity models. Oikos. 2013;122:492–506. doi: 10.1111/j.1600-0706.2012.00005.x. - DOI
Associated data
LinkOut - more resources
Full Text Sources
