

Bone Sialoprotein Shows Enhanced Expression in Early, High-Proliferation Stages of Three-Dimensional Spheroid Cell Cultures of Breast Cancer Cell Line MDA-MB-231
- PMID: 30805306
- PMCID: PMC6370714
- DOI: 10.3389/fonc.2019.00036
Bone Sialoprotein Shows Enhanced Expression in Early, High-Proliferation Stages of Three-Dimensional Spheroid Cell Cultures of Breast Cancer Cell Line MDA-MB-231
Abstract
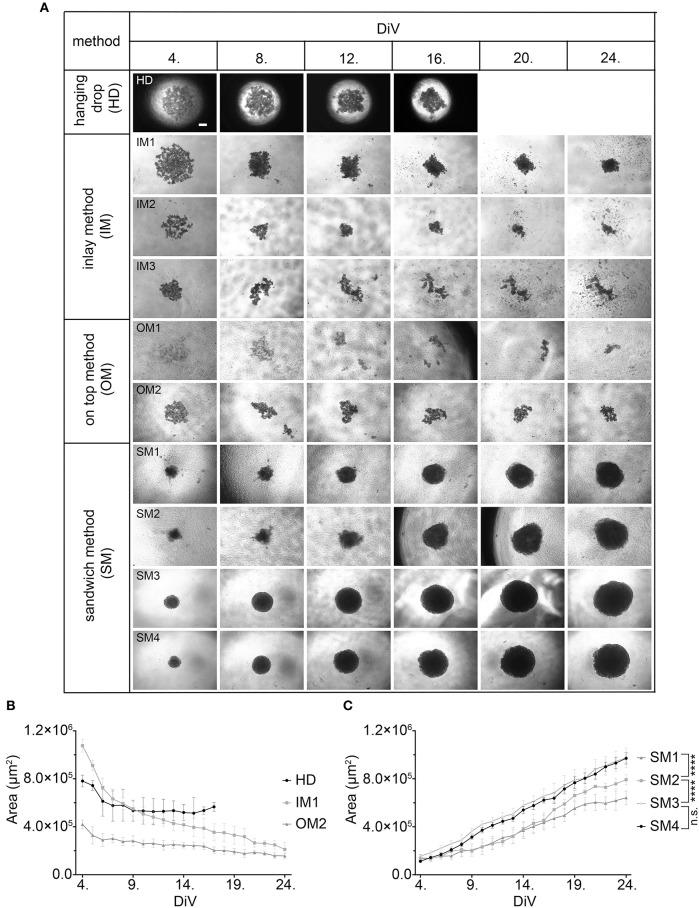
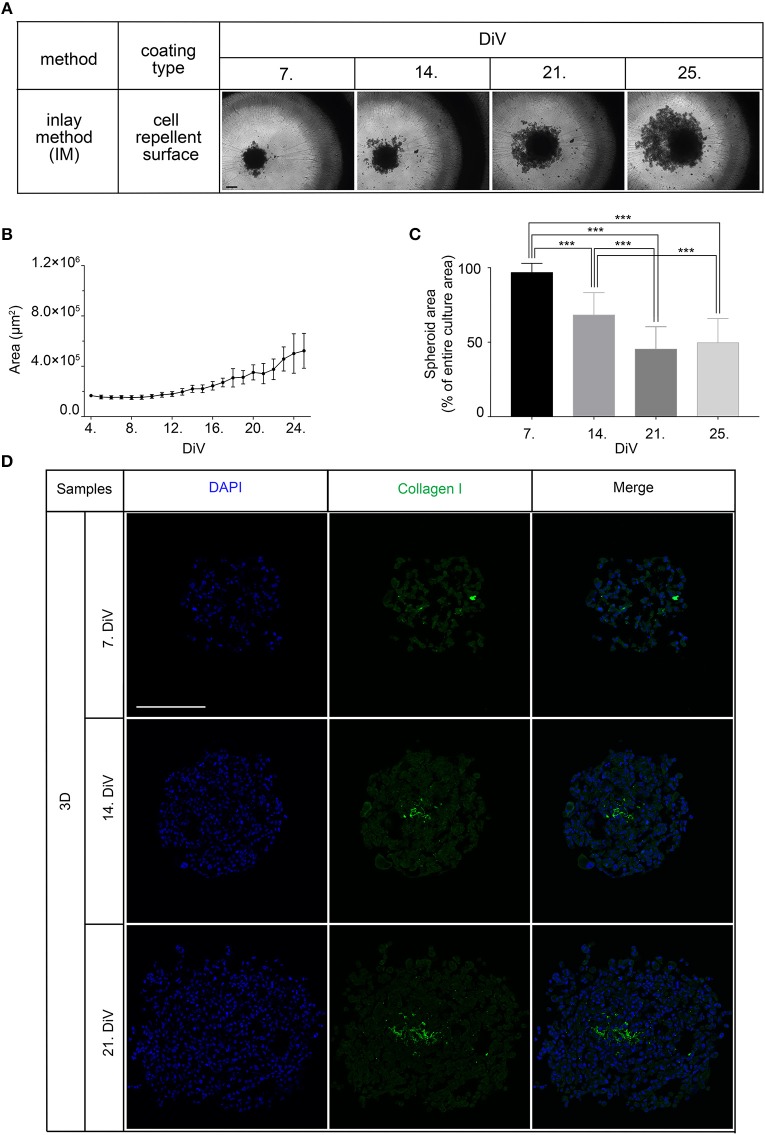
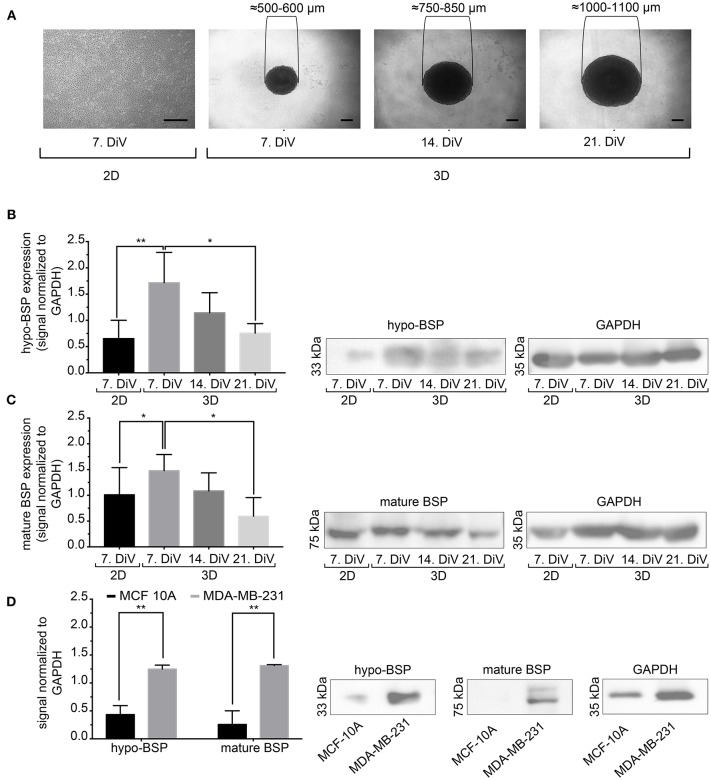
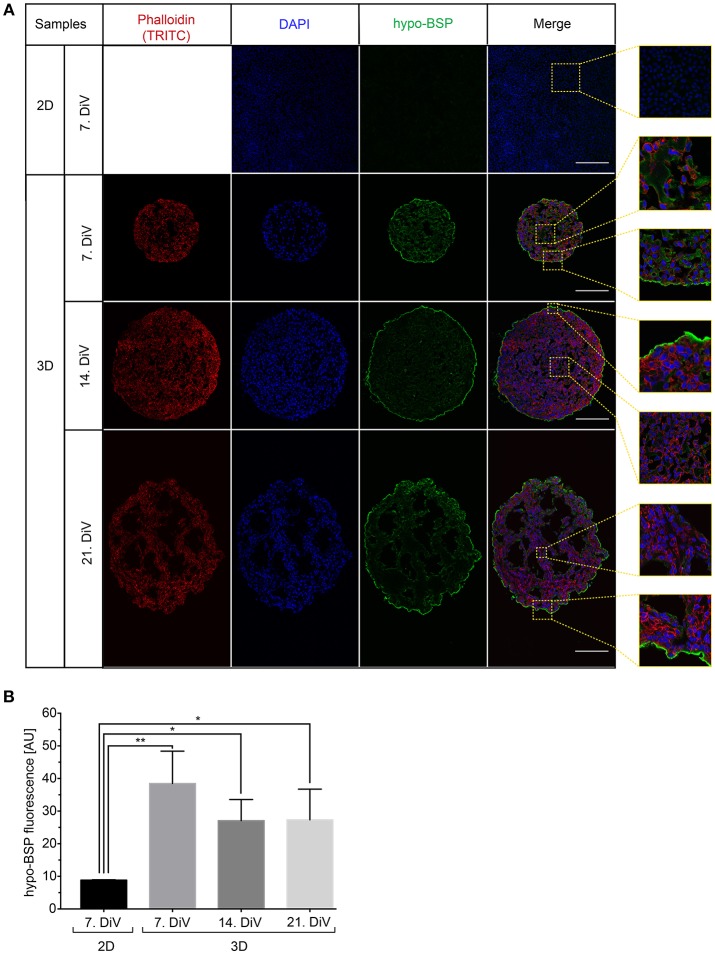
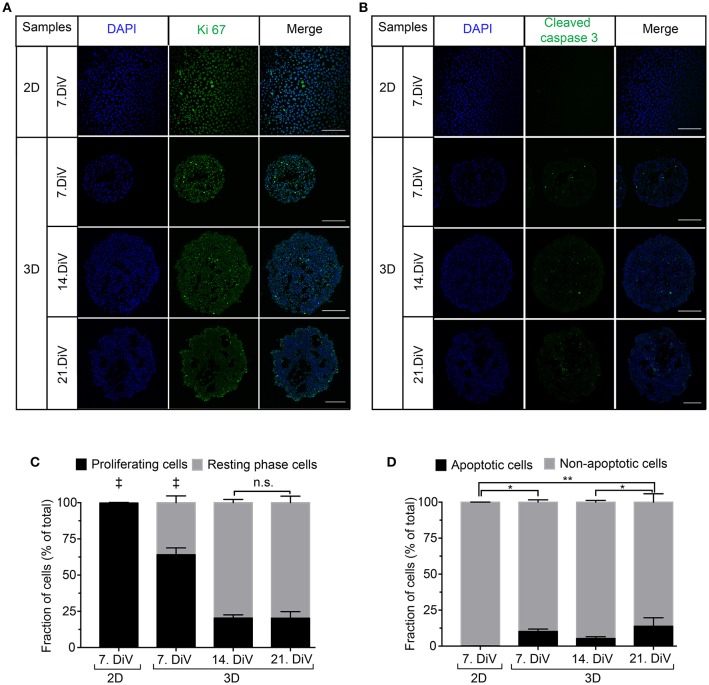
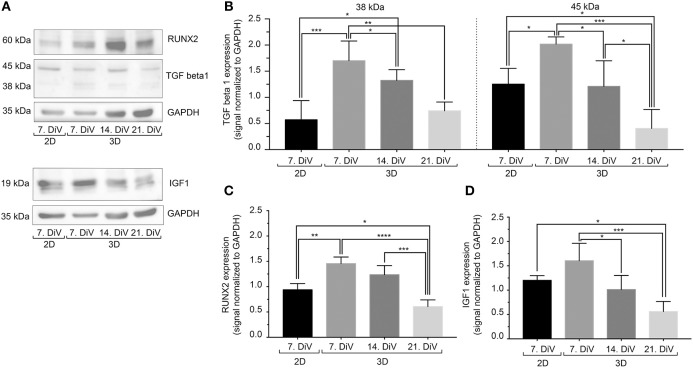
Normally, bone sialoprotein (BSP) is an important contributor to bone micro-calcification. However, it is also highly expressed in bone-metastatic malignancies, including prostate, lung, and breast cancer. In these disorders, BSP correlates with poor prognosis. Its expression in triple-negative breast cancer cells is enhanced by the transcription factor RUNX2, and both, BSP and RUNX2 are under control of IGF-1 and TGFβ1. Knockdown of BSP or its inactivation by specific antibodies were found to reduce the metastatic potential of MDA-MB-231 triple-negative breast cancer cells in xenografts. While the role of BSP in bone metastasis was studied using such in vivo models, valid in vitro test systems to investigate BSP biology have been lacking since this protein is expressed at very low levels in classical 2D cell cultures and the frequently used breast cancer cell line MDA-MB-231 is difficult to grow in 3D. Here, we have developed a long-term 3D spheroid culture model using MDA-MB-231 cells in a sandwich approach using cell embedding between a non-adherent surface and basement membrane extracts. This allowed consistent growth of spheroids for more than 21 days. Also, co-culturing of MDA-MB-231 with CCD-1137Sk fibroblasts yielded stably growing spheroids, suggesting the importance of extracellular matrix (ECM) in this process. In addition, we have set up a novel and simple open source analysis tool to characterize protein expression in 2D cultures and spheroids by immunofluorescence. Using this approach in combination with Western blot analysis, the expression profile of BSP was analyzed. BSP was enriched at the rims of spheroids, both in mono- and co-cultures and its abundance in general correlated with that of TGFβ1 under different conditions, including spheroid maturation, cytostatic treatment, and fibroblast co-culture. Conversely, correlation of IGF-1 and BSP was limited to mono-culture time course profiles. In conclusion, we present novel tools to study the regulation of gene expression in combination with cell proliferation and apoptosis in a long-term 3D model of breast cancer and find dynamic abundance profiles of the metastasis-relevant protein BSP and its regulators.
Keywords: 3D cell culture; BSP; MDA-MB-231; apoptosis; bone sialoprotein; breast cancer; proliferation; spheroid.
Figures
Similar articles
-
Extracellular Matrix Components Regulate Bone Sialoprotein Expression in MDA-MB-231 Breast Cancer Cells.Cells. 2021 May 24;10(6):1304. doi: 10.3390/cells10061304. Cells. 2021. PMID: 34073955 Free PMC article.
-
Characterization of Triple-Negative Breast Cancer MDA-MB-231 Cell Spheroid Model.Onco Targets Ther. 2020 Jun 11;13:5395-5405. doi: 10.2147/OTT.S249756. eCollection 2020. Onco Targets Ther. 2020. PMID: 32606757 Free PMC article.
-
Tumor cells are the source of osteopontin and bone sialoprotein expression in human breast cancer.Lab Invest. 1999 Jul;79(7):869-77. Lab Invest. 1999. PMID: 10418827
-
Expression of bone matrix proteins in human breast cancer: potential roles in microcalcification formation and in the genesis of bone metastases.Bull Cancer. 1997 Jan;84(1):17-24. Bull Cancer. 1997. PMID: 9180854 Review.
-
The progressive trend of modeling and drug screening systems of breast cancer bone metastasis.J Biol Eng. 2024 Feb 5;18(1):14. doi: 10.1186/s13036-024-00408-5. J Biol Eng. 2024. PMID: 38317174 Free PMC article. Review.
Cited by
-
Bone Sialoprotein Immobilized in Collagen Type I Enhances Angiogenesis In Vitro and In Ovo.Polymers (Basel). 2023 Feb 17;15(4):1007. doi: 10.3390/polym15041007. Polymers (Basel). 2023. PMID: 36850289 Free PMC article.
-
A Scaffold-Free 3-D Co-Culture Mimics the Major Features of the Reverse Warburg Effect In Vitro.Cells. 2020 Aug 13;9(8):1900. doi: 10.3390/cells9081900. Cells. 2020. PMID: 32823793 Free PMC article.
-
Fibroblasts Accelerate Formation and Improve Reproducibility of 3D Cellular Structures Printed with Magnetic Assistance.Research (Wash D C). 2020 Jul 23;2020:3970530. doi: 10.34133/2020/3970530. eCollection 2020. Research (Wash D C). 2020. PMID: 32776011 Free PMC article.
-
Myogenic Differentiation and Immunomodulatory Properties of Rat Adipose-Derived Mesenchymal Stem/Stromal Cells.Biology (Basel). 2024 Jan 25;13(2):72. doi: 10.3390/biology13020072. Biology (Basel). 2024. PMID: 38392291 Free PMC article.
-
Biological and Clinical Aspects of Metastatic Spinal Tumors.Cancers (Basel). 2022 Sep 22;14(19):4599. doi: 10.3390/cancers14194599. Cancers (Basel). 2022. PMID: 36230523 Free PMC article. Review.
References
LinkOut - more resources
Full Text Sources
Miscellaneous