. 2019 Apr 1;142(4):885-902.
doi: 10.1093/brain/awz032.

Ossified blood vessels in primary familial brain calcification elicit a neurotoxic astrocyte response

Affiliations

Ossified blood vessels in primary familial brain calcification elicit a neurotoxic astrocyte response

Yvette Zarb et al. Brain. .

Abstract

Brain calcifications are commonly detected in aged individuals and accompany numerous brain diseases, but their functional importance is not understood. In cases of primary familial brain calcification, an autosomally inherited neuropsychiatric disorder, the presence of bilateral brain calcifications in the absence of secondary causes of brain calcification is a diagnostic criterion. To date, mutations in five genes including solute carrier 20 member 2 (SLC20A2), xenotropic and polytropic retrovirus receptor 1 (XPR1), myogenesis regulating glycosidase (MYORG), platelet-derived growth factor B (PDGFB) and platelet-derived growth factor receptor β (PDGFRB), are considered causal. Previously, we have reported that mutations in PDGFB in humans are associated with primary familial brain calcification, and mice hypomorphic for PDGFB (Pdgfbret/ret) present with brain vessel calcifications in the deep regions of the brain that increase with age, mimicking the pathology observed in human mutation carriers. In this study, we characterize the cellular environment surrounding calcifications in Pdgfbret/ret animals and show that cells around vessel-associated calcifications express markers for osteoblasts, osteoclasts and osteocytes, and that bone matrix proteins are present in vessel-associated calcifications. Additionally, we also demonstrate the osteogenic environment around brain calcifications in genetically confirmed primary familial brain calcification cases. We show that calcifications cause oxidative stress in astrocytes and evoke expression of neurotoxic astrocyte markers. Similar to previously reported human primary familial brain calcification cases, we describe high interindividual variation in calcification load in Pdgfbret/ret animals, as assessed by ex vivo and in vivo quantification of calcifications. We also report that serum of Pdgfbret/ret animals does not differ in calcification propensity from control animals and that vessel calcification occurs only in the brains of Pdgfbret/ret animals. Notably, ossification of vessels and astrocytic neurotoxic response is associated with specific behavioural and cognitive alterations, some of which are associated with primary familial brain calcification in a subset of patients.

Keywords: PDGFB; neurotoxic astrocyte; ossification; prepulse inhibition; primary familial brain calcification.


Figures

Figure 1
Figure 1
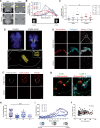
Interindividual variation in calcification load and osteoid-like consistency of brain calcifications in Pdgfbret/ret animals. (A) SWI sequence images and phase maps of the mouse brain. Calcifications (yellow arrows) were observed as black structures in the thalamic region on susceptibility-weighted images and as diamagnetic phase shifts on the corresponding phase maps. (B) Quantification of the calcification load in individual mice using susceptibility-weighted images, where calcification load is plotted against an individual imaged brain section (ventral to dorsal) and presented as box-plots indicating the mean and whiskers indicating minimum and maximum values, n = 6. (C) Quantification of calcification load using SWI analysis shows a significant difference between six individual Pdgfbret/ret mice (one-way ANOVA; P = 0.0284). Bar indicates the mean. (D) Bisphosphonates (AF647-RIS, in yellow) stain brain calcifications in cleared whole brains of Pdgfbret/ret animals. [D(i)] Sagittal view of a surface rendered image of the bisphosphonate staining. [D(ii)] Transverse view of bisphosphonate staining showing the bilateral distribution of brain calcifications. White dotted line delineates brain tissue. Scale bars = 3000 µm (D), 1000 µm [D(i)], 2000 µm [D(ii)]. (E) A subset of osteocalcin-positive (in red) calcifications are positive for collagen I (in cyan). In addition, collagen I-positive cells are observed around calcifications. Nuclei are visualized using DAPI (in white). Scale bar = 30 µm, magnified image = 4 µm. (F) A subset of osteocalcin-positive (in red) calcifications are positive for osteopontin (in white). Scale bar = 10 µm. (G). Osteocalcin-positive (in red) calcifications are vessel-associated (in green). Brain calcifications are surrounded by reactive astrocytes (in cyan). Scale bar = 20 µm. (H) Quantification of calcification number using immunohistochemistry shows a significant difference between four individual Pdgfbret/ret mice (one-way ANOVA; P = 0.0001). Bar indicates the mean. (I) Number of calcifications increase on the rostral-caudal axis. X-axis shows the number of analysed brain slices. Illustrative brain sections indicate an approximate anatomical position of analysed brain sections (Image credit: Allen Institute). n = 4. (J) Vessel density is plotted against the calcification load in the brain regions which show variable calcification load (sections 43–55, see I) (Pearson correlation, R2 = 0.0012). In total, 153 brain sections from four Pdgfbret/ret mice were analysed.
Figure 2
Figure 2
Presence of cells expressing osteoclast, osteoblast and osteocyte markers around calcifications in Pdgfbret/ret mouse brain. (A and B) Immunohistochemistry for osteoclast markers. (A) Cathepsin K-positive (in red) cells are observed in close vicinity to an osteocalcin-positive (in cyan) nodule. (B) RANK-positive cell (in cyan) around vessel-associated calcification (highlighted with yellow dotted line). (C) Staining of a cleared brain slice using a short peptide (DSS6) (in white) specifically recognizing bone formation sites. Yellow arrows point to calcifications. (D) Immunohistochemistry for an osteoblast marker. RUNX2-positive (in red) cells are observed in proximity to osteocalcin-positive (in cyan) calcifications. Magnified orthogonal view of dotted area shows nuclear localization of RUNX2. Yellow arrows point to RUNX2-positive cells seen in control mice where the localization of RUNX2 is cytoplasmic. (E) Immunohistochemistry for an osteocyte marker sclerostin (in red). DAPI-positive (in white) cell located inside a sclerostin-positive (in red) calcification. Nuclei are visualized using DAPI (in white). Scale bars = 10 µm (A, B, D and E), 3 µm (magnified image, D), 1000 µm (C).
Figure 4
Figure 4
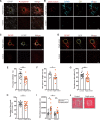
Neurotoxic astrocytes surround brain calcifications in Pdgfbret/ret animals and behavioral phenotype of Pdgfbret/ret animals. (A) Podoplanin is expressed by reactive astrocytes surrounding calcifications. GFAP-positive (in white) reactive astrocytes surrounding brain calcifications (marked with a yellow dotted circle) express podoplanin (in red). (B) marker for neurotoxic astrocytes, C3 (in yellow), co-localizes with GFAP staining (in cyan) around brain calcifications (in red) in Pdgfbret/ret mouse brains. (C) LCN2 (in white) co-localizes with GFAP staining (in red). (D) Carboxyethylpyrrole (CEP, in white) is found in GFAP-positive (in red) astrocytes around calcifications in Pdgfbret/ret mouse brain. Yellow dotted line in A, C and D mark calcifications. Scale bars = 30 µm (A), 15 µm (B), 10 µm (C) and 8 µm (D). (EJ) Behavioural phenotype of Pdgfbret/ret animals. (E) PPI test, where the mean PPI is expressed as a percentage and calculated from the reflex outcome of a combination of three different prepulses and three different pulses (P = 0.0005); n = 17–20: 17 Pdgfbret/ret, 20 controls. (F) Light-dark box experiment, where the time spent in the bright area is expressed as a percentage of time during 10 min (P = 0.039); n = 10. (G) Spontaneous alternation test, where the alternations carried out by the mouse within 5 min are expressed as a percentage (P = 0.0013); n = 18–20: 18 Pdgfbret/ret, 20 controls. (H) Social interaction test, where the time spent with the unfamiliar mouse over the dummy during 5 min is expressed in percentage (P = 0.241); n = 17–20: 17 Pdgfbret/ret, 20 controls. (I) Open field test, where the total distance travelled by mice during 45 min is expressed in centimetres (P = 0.0003); n = 18–20: nine Pdgfbret/ret males, nine control males, nine Pdgfbret/ret females, 11 control females (J) Tracking illustration of the distance one mouse travelled during 45 min. White dotted box marks the centre zone. All data are means ± SEM.
Figure 3
Figure 3
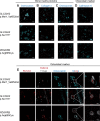
Presence of an osteogenic environment around brain calcifications in genetically confirmed PFBC. (AC) Immunohistochemistry of bone matrix proteins (in cyan). Brain calcifications in PFBC cases stain for osteocalcin (A), collagen I (B), and osteopontin (C). (D) Immunohistochemistry for an osteoclast marker. Brain calcifications stain for cathepsin K (in cyan), a protein secreted by osteoclasts, indicating the presence of osteoclast-like cells. (E) Immunohistochemistry for an osteoblast marker. Cells in the vicinity of brain calcifications (in cyan) express RUNX2 (in red) localized to the nucleus. Nuclei are visualized using DAPI (in white, AE). Magnified orthogonal views of dotted areas show nuclear localization of RUNX2. Scale bars = 30 µm (AD), 10 µm (E), and 3 µm (magnified image, E).
Figure 5
Figure 5
Alterations at the neurovascular unit accompanying vessel calcification in a mouse model of PFBC. Homeostasis: PDGFB/PDGFRB signalling at the neurovascular unit prevents vessel calcification. PDGFB is secreted by the endothelium and PDGFRB is expressed by mural cells and low level by astrocytes. Ossification of the neurovascular unit (NVU) in animal model of PFBC: altered PDGFB/PDGFRB signalling leads to the formation of bone cells (i.e. cells expressing osteoclast, osteoblast, osteocyte markers) and the deposition of structural bone proteins (e.g. collagen I, osteopontin, osteocalcin). Bone-like structures are closely surrounded by activated microglia and activated astrocytes. Astrocytes surrounding calcifications show signs of oxidative stress (i.e. CEP-positivity) and express markers for a subset of reactive astrocytes (LCN2, podoplanin), including the one for neurotoxic astrocytes (C3). Ossified vessels and neurotoxic astrocytic response is associated with neuronal dysfunction presenting in reduced PPI, hyperactivity, increased anxiety and impaired cognition. A = astrocyte; AEF = astrocyte endfeet; BM = basement membrane; E = endothelium; M = microglia; P = pericyte. Figure is modified from Betsholtz and Keller (2014).

Comment in

References

    1. Aikawa E, Nahrendorf M, Figueiredo JL, Swirski FK, Shtatland T, Kohler RH, et al.Osteogenesis associates with inflammation in early-stage atherosclerosis evaluated by molecular imaging in vivo. Circulation 2007; 116: 2841–50. - PubMed
    1. Apschner A, Huitema LF, Ponsioen B, Peterson-Maduro J, Schulte-Merker S. Zebrafish enpp1 mutants exhibit pathological mineralization, mimicking features of generalized arterial calcification of infancy (GACI) and pseudoxanthoma elasticum (PXE). Dis Model Mech 2014; 7: 811–22. - PMC - PubMed
    1. Arts FA, Velghe AI, Stevens M, Renauld JC, Essaghir A, Demoulin JB. Idiopathic basal ganglia calcification-associated PDGFRB mutations impair the receptor signalling. J Cell Mol Med 2015; 19: 239–48. - PMC - PubMed
    1. Baker M, Strongosky AJ, Sanchez-Contreras MY, Yang S, Ferguson W, Calne DB, et al.SLC20A2 and THAP1 deletion in familial basal ganglia calcification with dystonia. Neurogenetics 2014; 15: 23–30. - PMC - PubMed
    1. Benke T, Karner E, Seppi K, Delazer M, Marksteiner J, Donnemiller E. Subacute dementia and imaging correlates in a case of Fahr’s disease. J Neurol Neurosurg Psychiatry 2004; 75: 1163–5. - PMC - PubMed

Publication types

MeSH terms

Substances