. 2019 Apr 1;142(4):932-951.
doi: 10.1093/brain/awz015.

Interictal and ictal source localization for epilepsy surgery using high-density EEG with MEG: a prospective long-term study

Affiliations

Interictal and ictal source localization for epilepsy surgery using high-density EEG with MEG: a prospective long-term study

Chris Plummer et al. Brain. .

Abstract

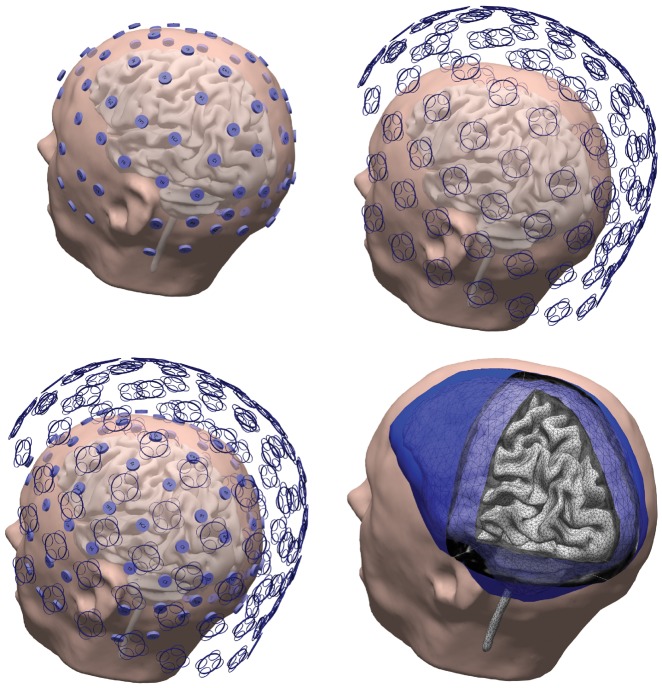
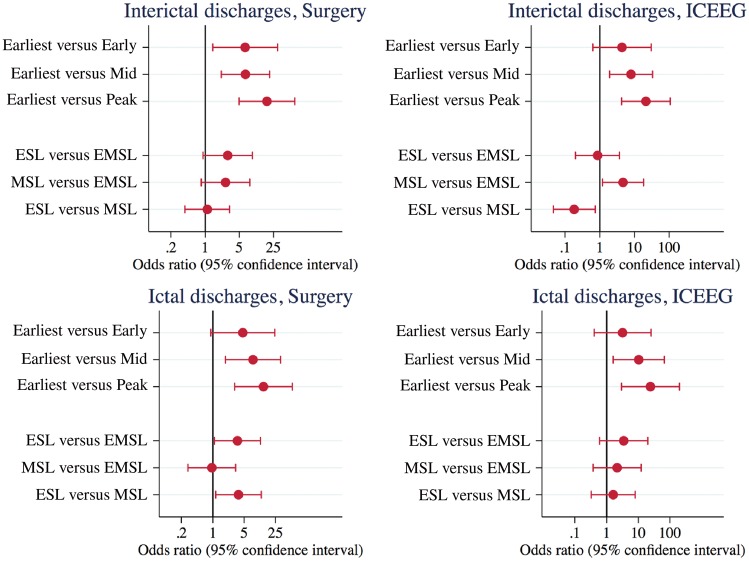
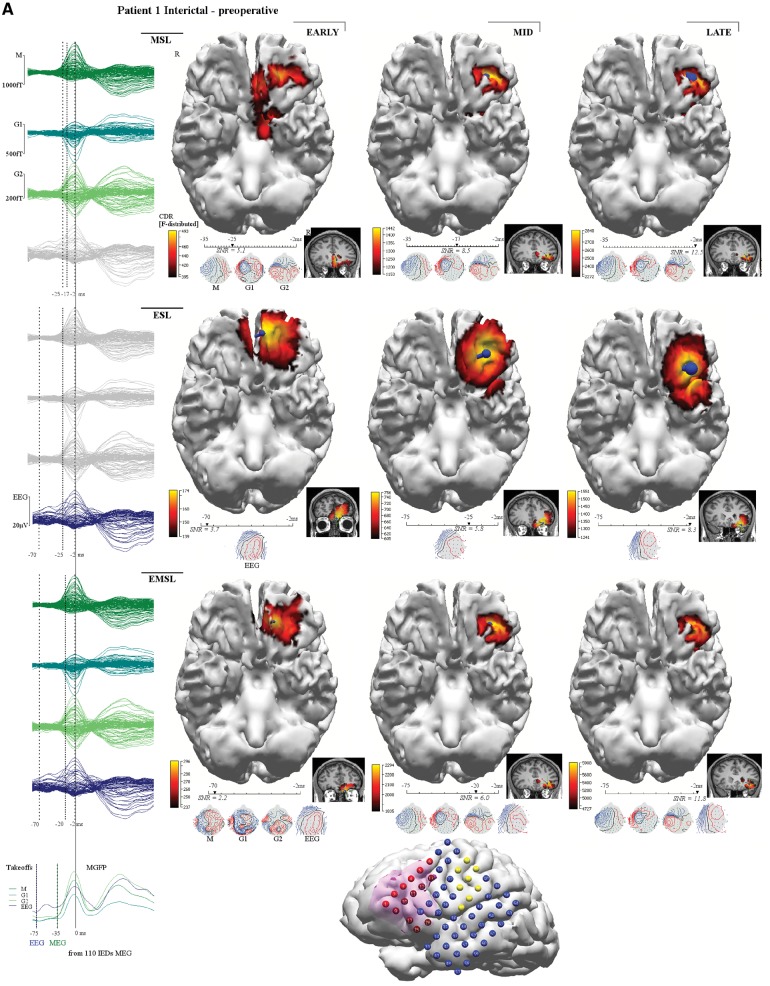
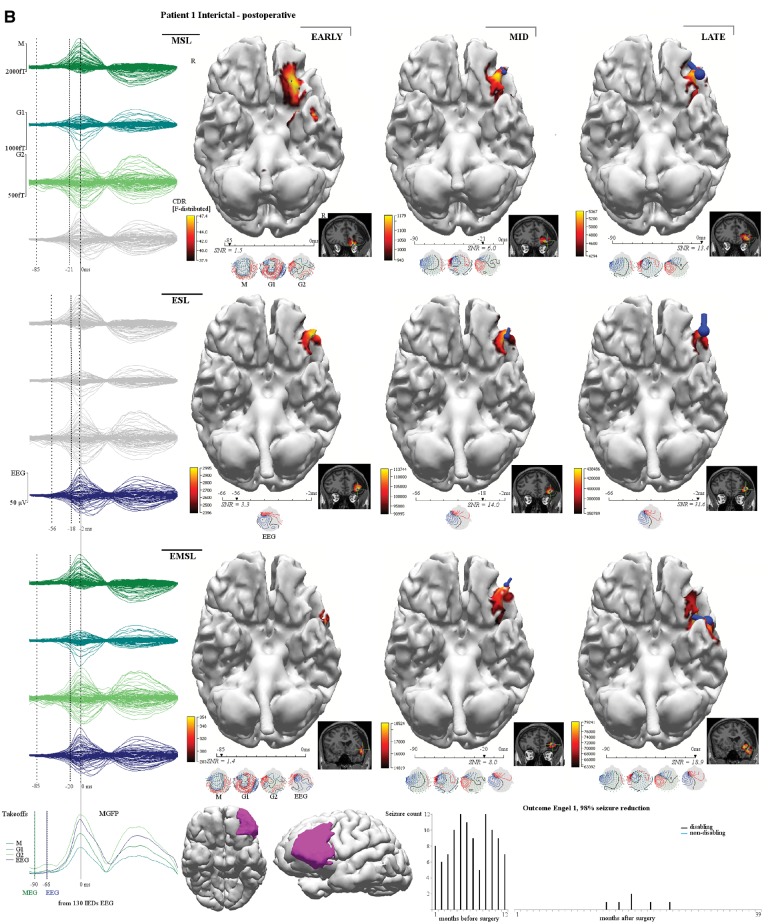
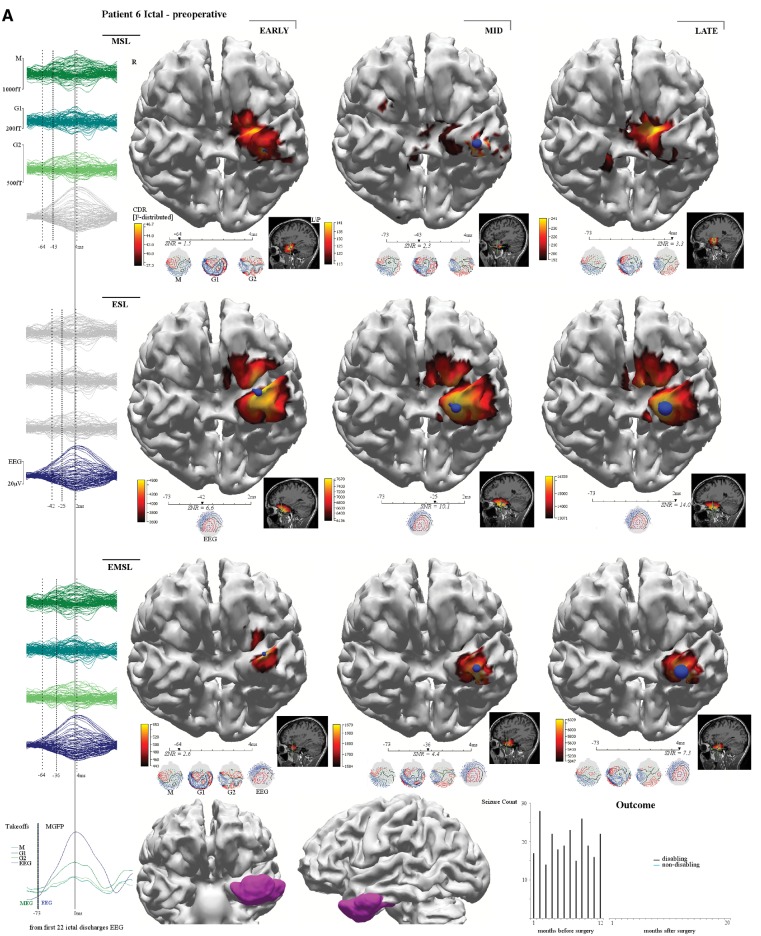
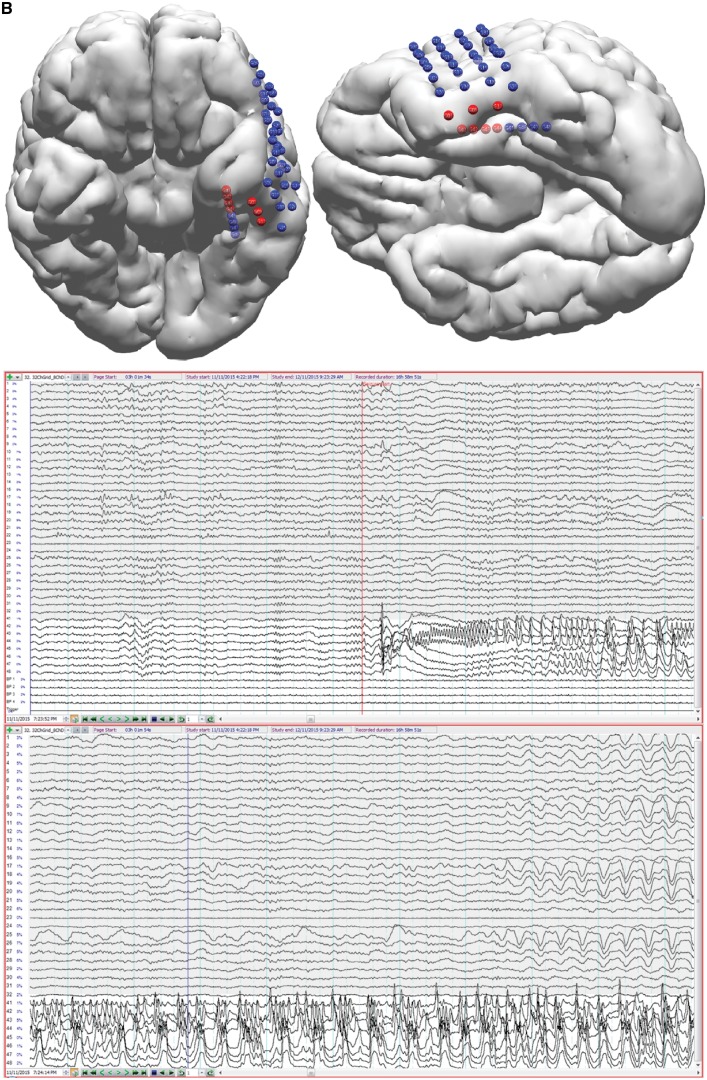
Drug-resistant focal epilepsy is a major clinical problem and surgery is under-used. Better non-invasive techniques for epileptogenic zone localization are needed when MRI shows no lesion or an extensive lesion. The problem is interictal and ictal localization before propagation from the epileptogenic zone. High-density EEG (HDEEG) and magnetoencephalography (MEG) offer millisecond-order temporal resolution to address this but co-acquisition is challenging, ictal MEG studies are rare, long-term prospective studies are lacking, and fundamental questions remain. Should HDEEG-MEG discharges be assessed independently [electroencephalographic source localization (ESL), magnetoencephalographic source localization (MSL)] or combined (EMSL) for source localization? Which phase of the discharge best characterizes the epileptogenic zone (defined by intracranial EEG and surgical resection relative to outcome)? Does this differ for interictal and ictal discharges? Does MEG detect mesial temporal lobe discharges? Thirteen patients (10 non-lesional, three extensive-lesional) underwent synchronized HDEEG-MEG (72-94 channel EEG, 306-sensor MEG). Source localization (standardized low-resolution tomographic analysis with MRI patient-individualized boundary-element method) was applied to averaged interictal epileptiform discharges (IED) and ictal discharges at three phases: 'early-phase' (first latency 90% explained variance), 'mid-phase' (first of 50% rising-phase, 50% mean global field power), 'late-phase' (negative peak). 'Earliest-solution' was the first of the three early-phase solutions (ESL, MSL, EMSL). Prospective follow-up was 3-21 (median 12) months before surgery, 14-39 (median 21) months after surgery. IEDs (n = 1474) were recorded, seen in: HDEEG only, 626 (42%); MEG only, 232 (16%); and both 616 (42%). Thirty-three seizures were captured, seen in: HDEEG only, seven (21%); MEG only, one (3%); and both 25 (76%). Intracranial EEG was done in nine patients. Engel scores were I (9/13, 69%), II (2/13,15%), and III (2/13). MEG detected baso-mesial temporal lobe epileptogenic zone sources. Epileptogenic zone OR [odds ratio(s)] were significantly higher for earliest-solution versus early-phase IED-surgical resection and earliest-solution versus all mid-phase and late-phase solutions. ESL outperformed EMSL for ictal-surgical resection [OR 3.54, 95% confidence interval (CI) 1.09-11.55, P = 0.036]. MSL outperformed EMSL for IED-intracranial EEG (OR 4.67, 95% CI 1.19-18.34, P = 0.027). ESL outperformed MSL for ictal-surgical resection (OR 3.73, 95% CI 1.16-12.03, P = 0.028) but was outperformed by MSL for IED-intracranial EEG (OR 0.18, 95% CI 0.05-0.73, P = 0.017). Thus, (i) HDEEG and MEG source solutions more accurately localize the epileptogenic zone at the earliest resolvable phase of interictal and ictal discharges, not mid-phase (as is common practice) or late peak-phase (when signal-to-noise ratios are maximal); (ii) from empirical observation of the differential timing of HDEEG and MEG discharges and based on the superiority of ESL plus MSL over either modality alone and over EMSL, concurrent HDEEG-MEG signals should be assessed independently, not combined; (iii) baso-mesial temporal lobe sources are detectable by MEG; and (iv) MEG is not 'more accurate' than HDEEG-emphasis is best placed on the earliest signal (whether HDEEG or MEG) amenable to source localization. Our findings challenge current practice and our reliance on invasive monitoring in these patients. 10.1093/brain/awz015_video1 awz015media1 6018582479001.

Keywords: combined electromagnetoencephalographic source localization; electroencephalographic source localization; high density electroencephalography; magnetoencephalographic source localization; magnetoencephalography.


Figures

Figure 1
Figure 1
Individualized HDEEG-MEG and boundary element method setup. Top left: Digitized locations of 94 electrode HDEEG configuration, including the 12-electrode inferior temporal array. Top right: 306 MEG sensors (102 magnetometers and 204 planar gradiometers). Bottom left: Spatial coverage of combined HDEEG-MEG from simultaneously acquired and synchronized data. Bottom right: Boundary element method (BEM) three-compartment tessellated head mode with skin (outer shell, smoothed), skull (dark-blue outer-skull shell, light-blue inner-skull shell showing intersecting vertices), boundary element method and cortically-constrained sources (vertices from tessellation superimposed on grey cortex surface) used for distributed current density reconstruction, generated from individual patient MRI (taken from Patient 1).
Figure 2
Figure 2
Odds ratios and 95% confidence intervals for source solution agreement with epileptogenic zone as defined by intracranial EEG and surgical resection margins. By phase, the results indicate better epileptogenic zone agreement for earliest (as first modality early-phase solution/s) against early-phase (ictal-SU) solutions, and against all corresponding mid-phase (as 50% mean global field power or 50% upstroke phase discharge, whichever first) and late-phase (negative peak) solutions. By method, epileptogenic zone agreement was better for ESL versus EMSL and for ESL versus MSL for ictal-SU, while epileptogenic zone agreement was better for MSL versus EMSL and for MSL versus ESL for IED-ICEEG. This indicates a superiority of independent ESL plus MSL over either method alone and over combined EMSL for non-invasive epileptogenic zone characterization. EZ = epileptogenic zone; SU = surgical resection margins.
Figure 3
Figure 3
Patient 1. This patient (MRI negative), had incomplete resection of the epileptogenic zone with six postoperative seizures around medication weaning (bottom right seizure chart). Left inferior frontal gyrus (IFG) and orbitofrontal gyrus (OFG) corticectomy showed type 1 dysplasia involving resection margins. (A) Preoperative interictal MSL (top row), ESL (middle row), EMSL (bottom row) suggested medial orbitofrontal gyrus and rectal gyrus (RG) onset with propagation to lateral orbitofrontal gyrus. Early-solutions (left column) for ESL and EMSL preceded early-MSL by 45 ms. (B) Post-operative interictal localization showed a similar pattern of onset and propagation but early-MSL preceded early ESL by 29 ms (early-late-EMSL localized to the superior temporal gyrus). Preoperative, mid-phase solutions (middle column in A) for MSL, ESL, and EMSL fell within the resection bed (magenta shading reconstructed cortex at the bottom of B) and were concordant with ICEEG (A) (red electrodes seizure onset, blue electrodes inactive at seizure onset, yellow electrodes map eloquent cortex for speech, motor) but the medial orbitofrontal gyrus was not covered by the grid; ICEEG position directed by broad fronto-temporal localization given by PET, video EEG monitoring and by lateral inferior frontal gyrus focus given by SPECT (Table 1) and by EEG-fMRI (not shown). The preoperative ictal results (not shown) reflect a similar pattern of discharge onset and propagation. Preoperative ictal early-MSL preceded early-ESL by 14 ms. ESL localized to the anterior inferior frontal gyrus and medial orbitofrontal gyrus while the earlier latency MSL solutions localized to the medial orbitofrontal gyrus and rectal gyrus. Taken together, the results are consistent with a left frontal source starting at the medial orbitofrontal gyrus and rectal gyrus and propagating to the lateral orbitofrontal gyrus and anterior inferior frontal gyrus, the latter supported by ICEEG. The patient is seizure free on re-instituted medication (months 26–39) with consideration of extended resection (involving medial orbitofrontal gyrus) should seizures return. Corresponding averaged waveforms are seen at left margin for MEG (top left, M = magnetometer; G1 = first planar gradiometer; G2 = second planar gradiometer), for HDEEG (middle left), and for combined HDEEG-MEG (bottom left). Corresponding early-phase, mid-phase, late-phase source localization latencies are marked by dotted vertical lines. MGFP (mean global field power) take-offs for HDEEG and MEG are shown at the bottom left corner. Take-off was defined as the first clear disruption of the background that achieved >50% amplitude of preceding baseline activity. The early-phase solution was the first solution to reach 90% explained variance along the millisecond-incremental time-course of the discharge from take-off. sLORETA (standardized low resolution tomographic analysis) current density reconstruction (CDR) maps are represented as F-distribution heat maps, with dominant orientation of distributed sources represented by a dark blue current density reconstruction moving ‘dipole’ (surface negative at spherical end of dipole), at reconstructed cortical surfaces and at MRI scans. HDEEG potentials and MEG fields are shown below the latency bars along with the corresponding SNR value of the signal at the solution time point. EZ = epileptogenic zone; VEM = video EEG monitoring.
Figure 3
Figure 3
Patient 1. This patient (MRI negative), had incomplete resection of the epileptogenic zone with six postoperative seizures around medication weaning (bottom right seizure chart). Left inferior frontal gyrus (IFG) and orbitofrontal gyrus (OFG) corticectomy showed type 1 dysplasia involving resection margins. (A) Preoperative interictal MSL (top row), ESL (middle row), EMSL (bottom row) suggested medial orbitofrontal gyrus and rectal gyrus (RG) onset with propagation to lateral orbitofrontal gyrus. Early-solutions (left column) for ESL and EMSL preceded early-MSL by 45 ms. (B) Post-operative interictal localization showed a similar pattern of onset and propagation but early-MSL preceded early ESL by 29 ms (early-late-EMSL localized to the superior temporal gyrus). Preoperative, mid-phase solutions (middle column in A) for MSL, ESL, and EMSL fell within the resection bed (magenta shading reconstructed cortex at the bottom of B) and were concordant with ICEEG (A) (red electrodes seizure onset, blue electrodes inactive at seizure onset, yellow electrodes map eloquent cortex for speech, motor) but the medial orbitofrontal gyrus was not covered by the grid; ICEEG position directed by broad fronto-temporal localization given by PET, video EEG monitoring and by lateral inferior frontal gyrus focus given by SPECT (Table 1) and by EEG-fMRI (not shown). The preoperative ictal results (not shown) reflect a similar pattern of discharge onset and propagation. Preoperative ictal early-MSL preceded early-ESL by 14 ms. ESL localized to the anterior inferior frontal gyrus and medial orbitofrontal gyrus while the earlier latency MSL solutions localized to the medial orbitofrontal gyrus and rectal gyrus. Taken together, the results are consistent with a left frontal source starting at the medial orbitofrontal gyrus and rectal gyrus and propagating to the lateral orbitofrontal gyrus and anterior inferior frontal gyrus, the latter supported by ICEEG. The patient is seizure free on re-instituted medication (months 26–39) with consideration of extended resection (involving medial orbitofrontal gyrus) should seizures return. Corresponding averaged waveforms are seen at left margin for MEG (top left, M = magnetometer; G1 = first planar gradiometer; G2 = second planar gradiometer), for HDEEG (middle left), and for combined HDEEG-MEG (bottom left). Corresponding early-phase, mid-phase, late-phase source localization latencies are marked by dotted vertical lines. MGFP (mean global field power) take-offs for HDEEG and MEG are shown at the bottom left corner. Take-off was defined as the first clear disruption of the background that achieved >50% amplitude of preceding baseline activity. The early-phase solution was the first solution to reach 90% explained variance along the millisecond-incremental time-course of the discharge from take-off. sLORETA (standardized low resolution tomographic analysis) current density reconstruction (CDR) maps are represented as F-distribution heat maps, with dominant orientation of distributed sources represented by a dark blue current density reconstruction moving ‘dipole’ (surface negative at spherical end of dipole), at reconstructed cortical surfaces and at MRI scans. HDEEG potentials and MEG fields are shown below the latency bars along with the corresponding SNR value of the signal at the solution time point. EZ = epileptogenic zone; VEM = video EEG monitoring.
Figure 4
Figure 4
Patient 6. This patient (MRI negative) had complete epileptogenic zone resection with 240 seizures over 12 months pre-surgery and no seizures to 20 months post-surgery. As a right-handed speech therapist, a left anterolateral temporal grid was planned based on PET (temporal pole) and SPECT (anterolateral temporal cortex) to avoid unwarranted resection of mesial temporal structures. Ictal early-MSL (mesial temporal) preceded early-ESL (anterior temporal pole) by 22 ms (A). Interictal (not shown) early-MSL and early-EMSL preceded early-ESL by 33 ms (all solutions baso-mesial temporal) with propagation to basolateral temporal cortex. These results led to the decision to place a left hippocampal depth electrode (B) (in addition to the grid). The seizure subsequently captured starts at the tip of the hippocampal depth electrode (four anterior red hippocampal electrodes, white background channels) and propagates to the inferior grid margin (three lower grid red electrodes, grey background channels). Standard (antero-mesial) temporal lobectomy (type 1C dysplasia entorhinal cortex) was not complicated by a language deficit. EZ = epileptogenic zone.
Figure 4
Figure 4
Patient 6. This patient (MRI negative) had complete epileptogenic zone resection with 240 seizures over 12 months pre-surgery and no seizures to 20 months post-surgery. As a right-handed speech therapist, a left anterolateral temporal grid was planned based on PET (temporal pole) and SPECT (anterolateral temporal cortex) to avoid unwarranted resection of mesial temporal structures. Ictal early-MSL (mesial temporal) preceded early-ESL (anterior temporal pole) by 22 ms (A). Interictal (not shown) early-MSL and early-EMSL preceded early-ESL by 33 ms (all solutions baso-mesial temporal) with propagation to basolateral temporal cortex. These results led to the decision to place a left hippocampal depth electrode (B) (in addition to the grid). The seizure subsequently captured starts at the tip of the hippocampal depth electrode (four anterior red hippocampal electrodes, white background channels) and propagates to the inferior grid margin (three lower grid red electrodes, grey background channels). Standard (antero-mesial) temporal lobectomy (type 1C dysplasia entorhinal cortex) was not complicated by a language deficit. EZ = epileptogenic zone.

Similar articles

Cited by

References

    1. Agirre-Arrizubieta Z, Huiskamp GJM, Ferrier CH, van Huffelen AC, Leijten FSS. Interictal magnetoencephalography and the irritative zone in the electrocorticogram. Brain 2009; 132: 3060–71. - PubMed
    1. Aydin U, Vorwerk J, Dumpelmann M, Kupper P, Kugel H, Heers M, et al.Combined EEG/MEG can outperform single modality EEG or MEG source reconstruction in presurgical epilepsy diagnosis. PLoS One 2015; 10: e0118753. - PMC - PubMed
    1. Aydin U, Vorwerk J, Kupper P, Heers M, Kugel H, Galka A, et al.Combining EEG and MEG for the reconstruction of epileptic activity using a calibrated realistic volume conductor model. PLoS One 2014; 9: e93154. - PMC - PubMed
    1. Baumgartner C, Pataraia E, Lindinger G, Deecke L. Neuromagnetic recordings in temporal lobe epilepsy. J Clin Neurophysiol 2000; 17: 177–89. - PubMed
    1. Choi JH, Jung YJ, Jung HK, Im CH. A new multimodal cortical source imaging algorithm for integrating simultaneously recorded EEG and MEG. Inverse Probl Sci Eng 2013; 21: 1074–89.

Publication types