

Tracing the Impact of Public Health Interventions on HIV-1 Transmission in Portugal Using Molecular Epidemiology
- PMID: 30805610
- PMCID: PMC6581889
- DOI: 10.1093/infdis/jiz085
Tracing the Impact of Public Health Interventions on HIV-1 Transmission in Portugal Using Molecular Epidemiology
Abstract
Background: Estimation of temporal changes in human immunodeficiency virus (HIV) transmission patterns can help to elucidate the impact of preventive strategies and public health policies.
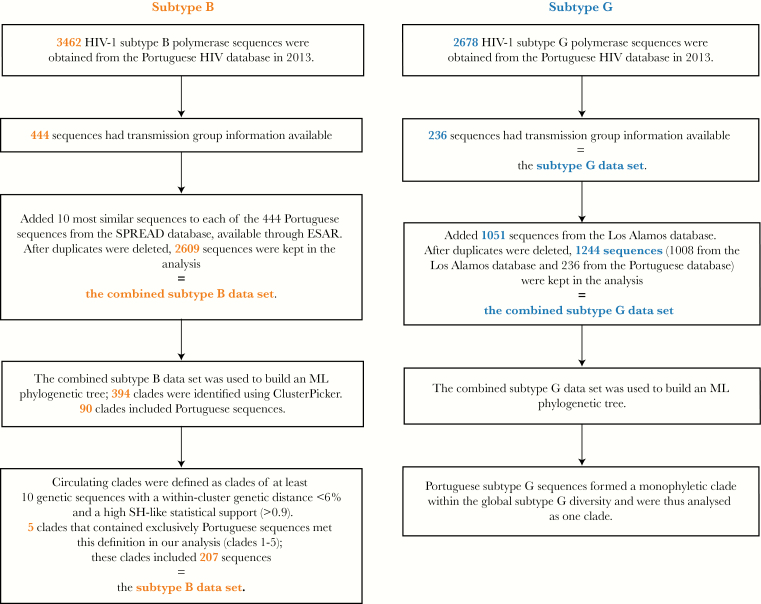
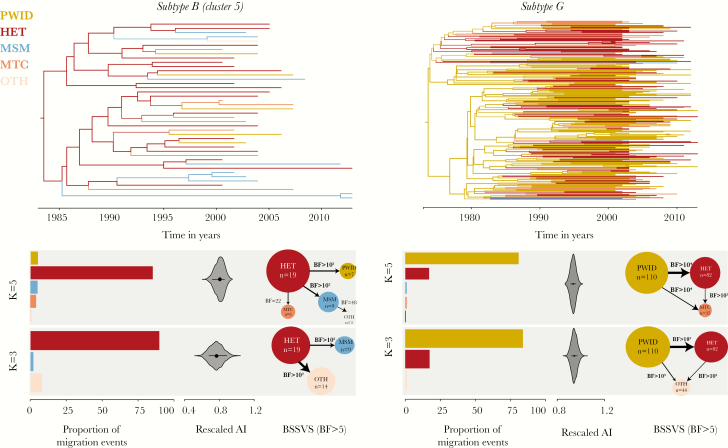
Methods: Portuguese HIV-1 subtype B and G pol genetic sequences were appended to global reference data sets to identify country-specific transmission clades. Bayesian birth-death models were used to estimate subtype-specific effective reproductive numbers (Re). Discrete trait analysis (DTA) was used to quantify mixing among transmission groups.
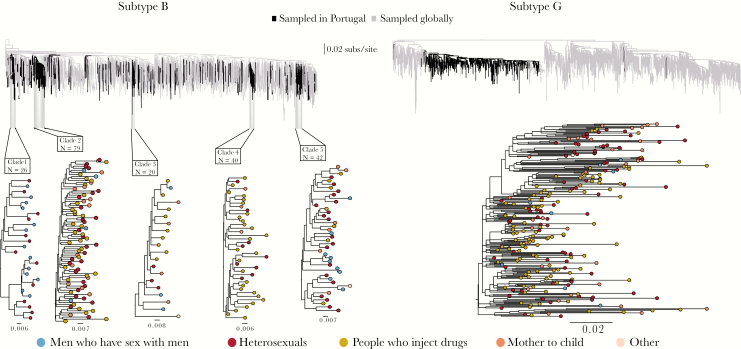
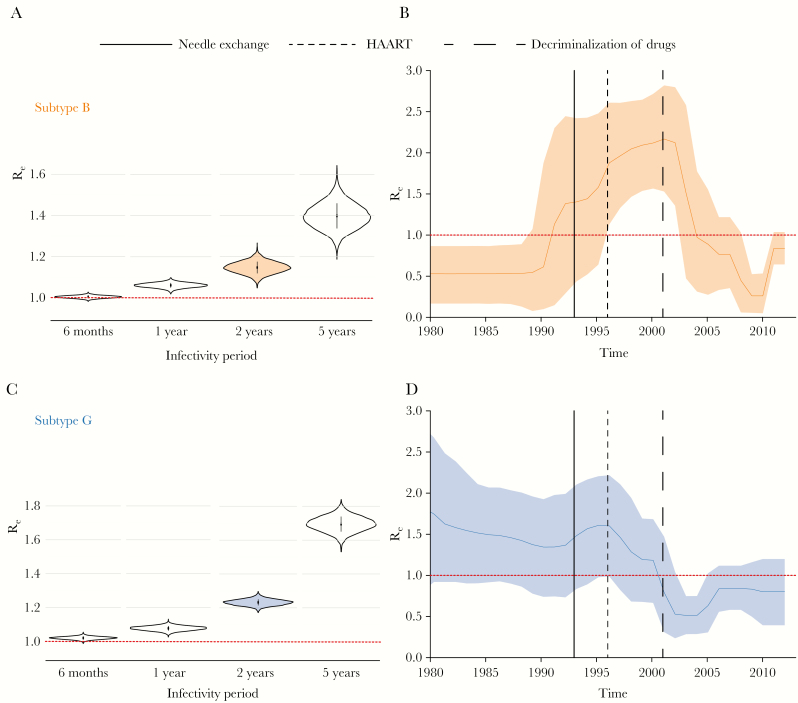
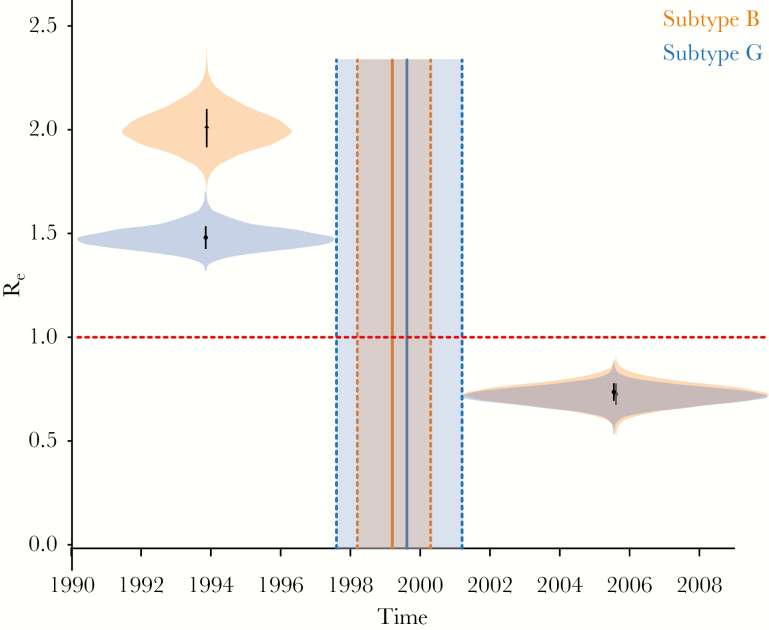
Results: We identified 5 subtype B Portuguese clades (26-79 sequences) and a large monophyletic subtype G Portuguese clade (236 sequences). We estimated that major shifts in HIV-1 transmission occurred around 1999 (95% Bayesian credible interval [BCI], 1998-2000) and 2000 (95% BCI, 1998-2001) for subtypes B and G, respectively. For subtype B, Re dropped from 1.91 (95% BCI, 1.73-2.09) to 0.62 (95% BCI,.52-.72). For subtype G, Re decreased from 1.49 (95% BCI, 1.39-1.59) to 0.72 (95% BCI, .63-.8). The DTA suggests that people who inject drugs (PWID) and heterosexuals were the source of most (>80%) virus lineage transitions for subtypes G and B, respectively.
Conclusions: The estimated declines in Re coincide with the introduction of highly active antiretroviral therapy and the scale-up of harm reduction for PWID. Inferred transmission events across transmission groups emphasize the importance of prevention efforts for bridging populations.
Keywords: HIV; Portugal; epidemiology; harm reduction; phylodynamics; reproductive number; transmission groups.
© The Author(s) 2019. Published by Oxford University Press for the Infectious Diseases Society of America.
Figures
Similar articles
-
Detailed Molecular Surveillance of the HIV-1 Outbreak Among People who Inject Drugs (PWID) in Athens During a Period of Four Years.Curr HIV Res. 2017;15(6):396-404. doi: 10.2174/1570162X15666171120104048. Curr HIV Res. 2017. PMID: 29165088
-
Evolutionary history and spatiotemporal dynamics of the HIV-1 subtype B epidemic in Guatemala.PLoS One. 2018 Sep 13;13(9):e0203916. doi: 10.1371/journal.pone.0203916. eCollection 2018. PLoS One. 2018. PMID: 30212548 Free PMC article.
-
The Changing Epidemiological Profile of HIV-1 Subtype B Epidemic in Ukraine.AIDS Res Hum Retroviruses. 2019 Feb;35(2):155-163. doi: 10.1089/AID.2018.0167. Epub 2019 Jan 14. AIDS Res Hum Retroviruses. 2019. PMID: 30430838 Free PMC article.
-
Molecular epidemiology of HIV-1 infection in Europe: An overview.Infect Genet Evol. 2016 Dec;46:180-189. doi: 10.1016/j.meegid.2016.06.033. Epub 2016 Jun 16. Infect Genet Evol. 2016. PMID: 27321440 Review.
-
Overview of HIV molecular epidemiology among people who inject drugs in Europe and Asia.Infect Genet Evol. 2016 Dec;46:256-268. doi: 10.1016/j.meegid.2016.06.017. Epub 2016 Jun 7. Infect Genet Evol. 2016. PMID: 27287560 Free PMC article. Review.
Cited by
-
Epidemiology and Molecular Transmission Characteristics of HIV in the Capital City of Anhui Province in China.Pathogens. 2021 Nov 29;10(12):1554. doi: 10.3390/pathogens10121554. Pathogens. 2021. PMID: 34959509 Free PMC article.
-
Phylodynamics Helps to Evaluate the Impact of an HIV Prevention Intervention.Viruses. 2020 Apr 20;12(4):469. doi: 10.3390/v12040469. Viruses. 2020. PMID: 32326127 Free PMC article.
-
Limited Sustained Local Transmission of HIV-1 CRF01_AE in New South Wales, Australia.Viruses. 2019 May 27;11(5):482. doi: 10.3390/v11050482. Viruses. 2019. PMID: 31137836 Free PMC article.
-
Characterising HIV-1 transmission in Victoria, Australia: a molecular epidemiological study.Lancet Reg Health West Pac. 2024 Jun 7;47:101103. doi: 10.1016/j.lanwpc.2024.101103. eCollection 2024 Jun. Lancet Reg Health West Pac. 2024. PMID: 38953059 Free PMC article.
-
Toward a global virus genomic surveillance network.Cell Host Microbe. 2023 Jun 14;31(6):861-873. doi: 10.1016/j.chom.2023.03.003. Epub 2023 Mar 6. Cell Host Microbe. 2023. PMID: 36921604 Free PMC article. Review.
References
-
- Esteves A, Parreira R, Venenno T, et al. . Molecular epidemiology of HIV type 1 infection in Portugal: high prevalence of non-B subtypes. AIDS Res Hum Retroviruses 2002; 18:313–25. - PubMed
-
- Amaral JA, Pereira EP, Paixao MT. Data and projections of HIV/AIDS cases in Portugal: an unstoppable epidemic? J Appl Stat 2005; 32:127–40.
-
- European Centre for Disease Prevention and Control WROfE. HIV/AIDS surveillance in Europe: surveillance report. Stockholm: ECDC, 2015.
-
- INSA DdDaId. Infeção VIH SIDA: a situação em Portugal a 31 de dezembro de 2014. Lisboa: Instituto Nacional de Saúde Doutor Ricardo Jorge, 2015.
