. 2019 May;28(5):964-970.
doi: 10.1002/pro.3594. Epub 2019 Mar 12.

Crystal structure of the apo form of a β-transaminase from Mesorhizobium sp. strain LUK

Affiliations

Crystal structure of the apo form of a β-transaminase from Mesorhizobium sp. strain LUK

Sunghark Kwon et al. Protein Sci. 2019 May.

Abstract

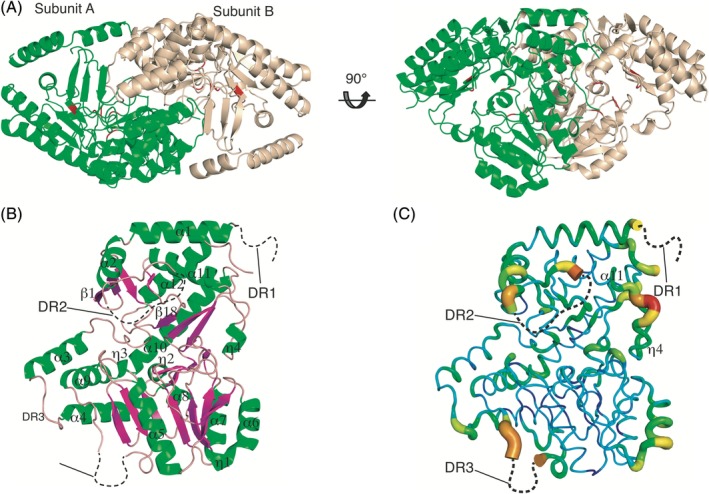
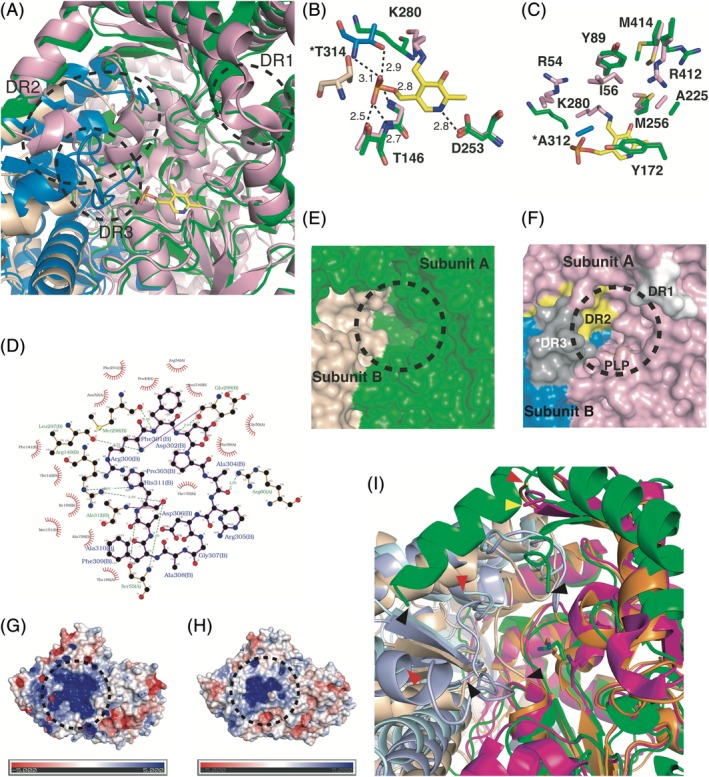
Pyridoxal 5'-phosphate (PLP)-dependent β-transaminases (βTAs) reversibly catalyze transamination reactions by recognizing amino groups linked to the β-carbon atoms of their substrates. Although several βTA structures have been determined as holo forms containing PLP, little is known about the effect of PLP on the conversion of the apo structure to the holo structure. We determined the crystal structure of the apo form of a βTA from Mesorhizobium sp. strain LUK at 2.2 Å resolution to elucidate how PLP affects the βTA structure. The structure revealed three major disordered regions near the active site. Structural comparison with the holo form also showed that the disordered regions in the apo form are ordered and partially adopt secondary structures in the holo form. These findings suggest that PLP incorporation into the active site contributes to the structural stability of the active site architecture, thereby forming the complete active site. Our results provide novel structural insights into the role of PLP in terms of active site formation.

Keywords: Mesorhizobium sp. strain LUK; apo form; disorder-to-order transition; pyridoxal 5′-phosphate; β-transaminase.


Figures

Figure 1
Figure 1
Crystal structure of aMs‐βTA. (A) Overall structure of aMs‐βTA. The dimeric structure is shown in a cartoon representation and viewed from two different directions. Subunits A and B are colored green and light yellow, respectively. Residues forming the active site are marked with red. (B) Subunit A structure of aMs‐βTA. Three disordered regions are depicted as black dashed curves. Secondary structures are labeled at the corresponding positions. Marks from β2 to β17 are omitted for clarity. (C) B‐factor distribution of aMs‐βTA. The structure is presented in a putty representation and rainbow colored from red to violet in B‐factor value order.
Figure 2
Figure 2
Structural comparison between the apo and holo forms of Ms‐βTA. (A) Structural comparison between aMs‐βTA and hMs‐βTA with a focus of the active site. The structure of hMs‐βTA is superimposed onto that of aMs‐βTA. Subunits A and B of aMs‐βTA are colored green and light yellow, respectively. Subunits A and B of hMs‐βTA are colored pink and marine, respectively. The PLP molecule in hMs‐βTA is shown in a stick representation. (B) PLP coordination to adjacent residues. The PLP molecule and its binding residues are depicted as sticks. The residues of aMs‐βTA (Subunit A) and hMs‐βTA (Subunit B) and the PLP molecule are colored green, pink, and yellow, respectively. The residues of aMs‐βTA (Subunit B) and hMs‐βTA (Subunit B) are colored light yellow and marine, respectively. The asterisk of T314 denotes a residue from the other subunit. (C) Active site residues. The display mode and color code are the same as that of panel (B). The asterisk of A312 denotes a residue from the other subunit. (D) Diagram for interactions between the two disordered regions. The DR3 residues from Subunit B interact with adjacent residues, including the DR2 residues from Subunit A. Surface representation of the active site of aMs‐βTA (E) and hMs‐βTA (F). The color code is the same as that of panel (A) except DR1–DR3. The black dashed circles denote the active site entrances. The DR1–DR3 regions in panel (F) corresponding to disordered regions in aMs‐βTA are structured in hMs‐βTA. The DR1 (Subunit A), DR2 (Subunit A), and DR3 (Subunit B) regions are colored white, yellow, and gray, respectively. The asterisk of DR3 indicates that it belongs to Subunit B. Surface electrostatic potential of aMs‐βTA (G) and hMs‐βTA (H). The respective surface electrostatic distributions are represented. The scale ranges from −5 kT/e (red) to 5 kT/e (blue). The black dashed circles indicate the active site entrances. (I) Structural comparison between three apo forms: Subunits A (green) and B (light yellow) of aMs‐βTA, Subunits A (magenta) and B (light blue) of aVf‐ωTA, and Subunits A (orange) and B (palecyan) of aCv‐ωTA. The key Lys residues are represented as sticks. The black, yellow, and red triangles indicate the edges of disordered regions of aMs‐βTA, aVf‐ωTA, and aCv‐ωTA, respectively.

Similar articles

Cited by

References

    1. Rudat J, Brucher BR, Syldatk C (2012) Transaminases for the synthesis of enantiopure beta‐amino acids. AMB Express 2:11. - PMC - PubMed
    1. Sugawara T, Tanaka A, Tanaka K, Nagai K, Suzuki K, Suzuki T (1998) YM‐170320, a novel lipopeptide antibiotic inducing morphological change of colonies in a mutant of Candida tropicalis pK233. J Antibiot (Tokyo) 51:435–438. - PubMed
    1. Sathe M, Thavaselvam D, Srivastava AK, Kaushik MP (2008) Synthesis and antimalarial evaluation of cyclic beta‐amino acid‐containing dipeptides. Molecules 13:432–443. - PMC - PubMed
    1. Nurbo J, Peterson SD, Dahl G, Danielson UH, Karlén A, Sandström A (2008) Beta‐amino acid substitutions and structure‐based CoMFA modeling of hepatitis C virus NS3 protease inhibitors. Bioorg Med Chem 16:5590–5605. - PubMed
    1. Miura K, Sawa T, Takeuchi T, Umezawa H (1986) Effects of enzyme‐inhibitors in inhibiting the growth and inducing the differentiation of human promyelocytic leukemia‐cells, HL‐60. J Antibiot (Tokyo) 39:734–735. - PubMed

Publication types