. 2019 Jul 1;28(13):2143-2160.
doi: 10.1093/hmg/ddz048.

Quantitative proteomics identifies proteins that resist translational repression and become dysregulated in ALS-FUS

Affiliations

Quantitative proteomics identifies proteins that resist translational repression and become dysregulated in ALS-FUS

Desiree M Baron et al. Hum Mol Genet. .

Abstract

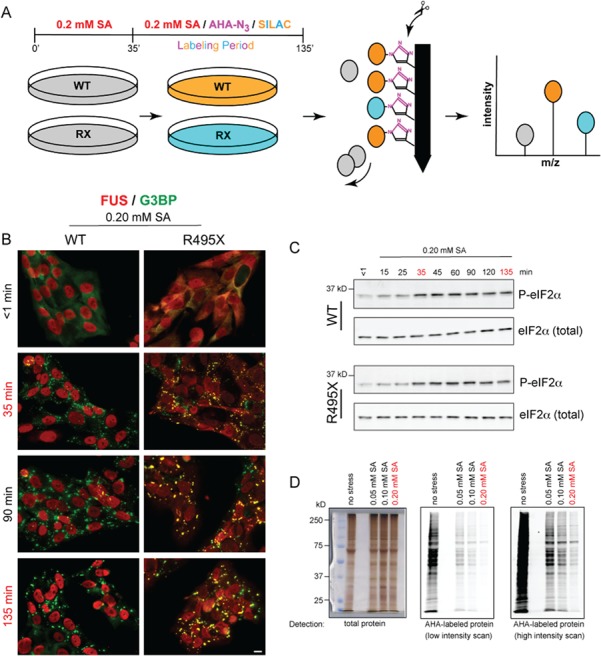
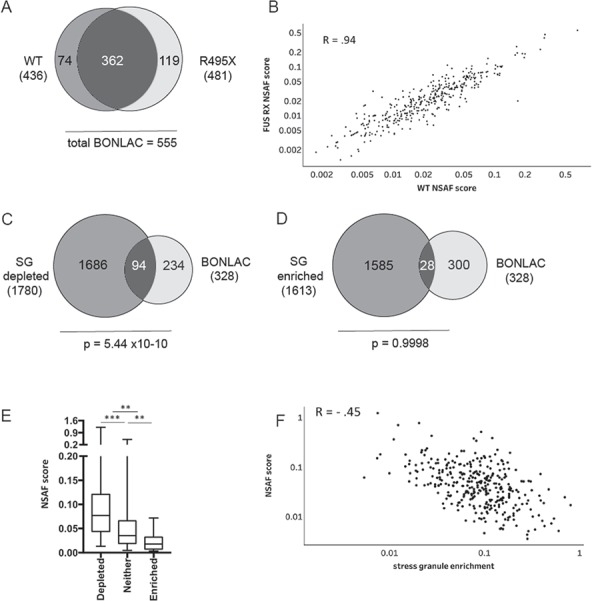
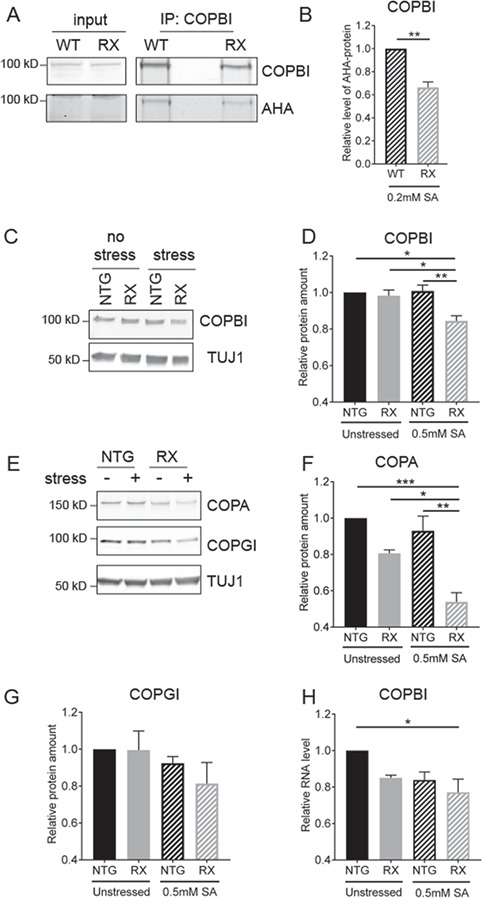
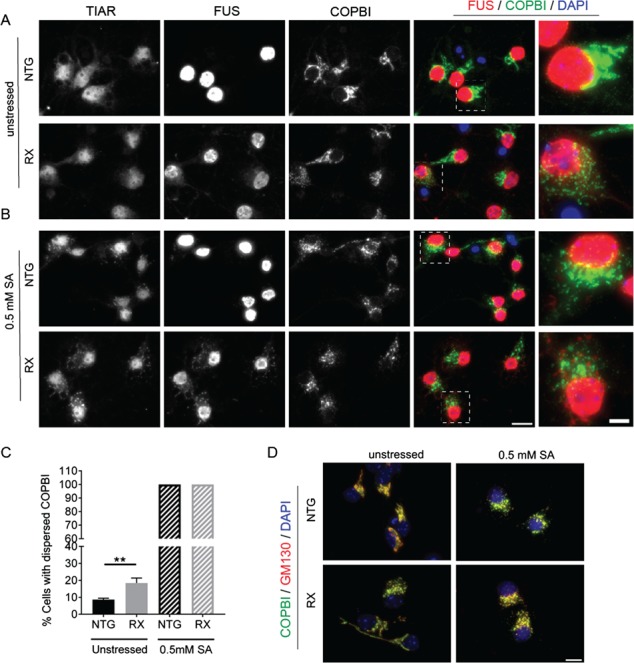
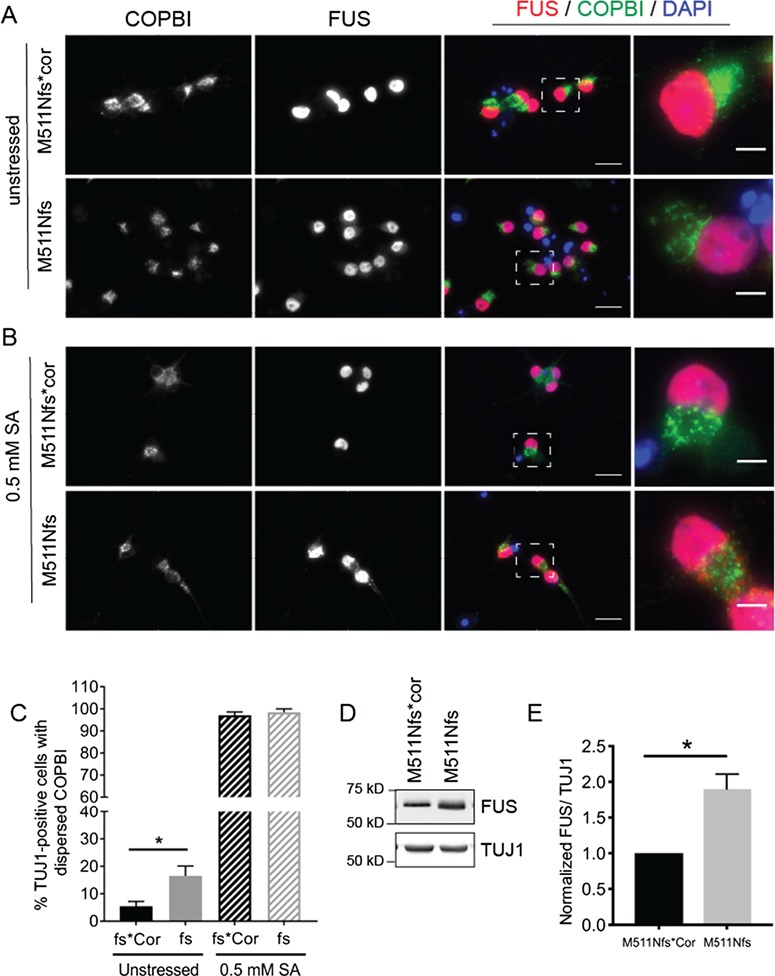
Aberrant translational repression is a feature of multiple neurodegenerative diseases. The association between disease-linked proteins and stress granules further implicates impaired stress responses in neurodegeneration. However, our knowledge of the proteins that evade translational repression is incomplete. It is also unclear whether disease-linked proteins influence the proteome under conditions of translational repression. To address these questions, a quantitative proteomics approach was used to identify proteins that evade stress-induced translational repression in arsenite-treated cells expressing either wild-type or amyotrophic lateral sclerosis (ALS)-linked mutant FUS. This study revealed hundreds of proteins that are actively synthesized during stress-induced translational repression, irrespective of FUS genotype. In addition to proteins involved in RNA- and protein-processing, proteins associated with neurodegenerative diseases such as ALS were also actively synthesized during stress. Protein synthesis under stress was largely unperturbed by mutant FUS, although several proteins were found to be differentially expressed between mutant and control cells. One protein in particular, COPBI, was downregulated in mutant FUS-expressing cells under stress. COPBI is the beta subunit of the coat protein I (COPI), which is involved in Golgi to endoplasmic reticulum (ER) retrograde transport. Further investigation revealed reduced levels of other COPI subunit proteins and defects in COPBI-relatedprocesses in cells expressing mutant FUS. Even in the absence of stress, COPBI localization was altered in primary and human stem cell-derived neurons expressing ALS-linked FUS variants. Our results suggest that Golgi to ER retrograde transport may be important under conditions of stress and is perturbed upon the expression of disease-linked proteins such as FUS.


Figures

Figure 1
Figure 1
Experimental conditions for the BONLAC study. (A) A schematic diagram of the BONLAC pipeline. FUS WT and R495X (RX) cells were exposed to SA stress for 35 min, after which cells were switched to media containing AHA-NH3 (AHA), isotopically labeled amino acids for SILAC and SA for an additional 100 min ‘labeling period’. FUS WT cells were grown in medium (orange) and FUS RX cells in heavy (blue) isotopically labeled media for two biological experiments; labels were reversed for the third experiment. FUS WT and R495X lysates were combined, and proteins synthesized under stress that contained the AHA label (pink) were subjected to copper catalyzed cycloaddition click chemistry with an alkyne-conjugated resin. Pre-existing, unlabeled proteins (gray) were removed and bound proteins eluted via proteolysis. Peptides were identified through tandem mass spectrometry (MS2) in FUS WT versus R495X cells, and unlabeled peptides that evaded the wash step were identified as such by the MS2 analysis. The MS1 scan was used for the SILAC quantitation of peptides that were detected in both FUS WT and R495X samples. (B) Representative immunofluorescence micrographs of inducible SK-N-AS cells expressing untagged FUS WT or R495X upon treatment with 0.2 mm SA probed with anti-FUS (red) and anti-G3BP (green) antibodies. Stress granule (G3BP, green) formation was detectable by 35 min and continued during the 100 min labeling period. Scale bar, 10um. (C) Western blot analysis of the cell lines in (B) shows an increase in eIF2α phosphorylation (anti-P-eIF2α) relative to total eIF2α levels (anti-eIF2α total). (D) Relative to total protein (silver-stained gel, left), levels of newly synthesized AHA-labeled protein from naïve SK-N-AS cells decrease with increasing concentrations of SA.
Figure 2
Figure 2
Analysis of proteins that are actively translated during stress. (A) Venn diagram for the number of proteins identified in FUS WT (dark gray; 436) or R495X (light gray; 481) SK-N-AS cells over three independent BONLAC experiments. The 362 proteins that were consistently detected in both FUS WT and R495X cells were used for subsequent DAVID analysis (Supplementary Material, Dataset S2) and were compared to published SG transcriptomics results [see (C)–(F) below and Supplementary Material, Dataset S1]. (B) A comparison of the NSAF scores in WT versus FUS R495X samples over three independent BONLAC experiments. (C) Venn diagram depicting overlap of transcripts identified by BONLAC and transcripts identified as depleted in the stress granule transcriptome (P = 5.44 × 10−10). (D) Venn diagram depicting overlap of transcripts identified by BONLAC and transcripts identified as enriched in the stress granule transcriptome (P = 0.9998). (E) Boxplot of NSAF scores for corresponding transcripts that are depleted, neither depleted nor enriched or enriched in SGs. (F) Scatter plot of NSAF scores versus SG enrichment shows a moderate inverse correlation (R = −0.45) between proteins that are synthesized under stress and the localization of the corresponding transcript within SGs.
Figure 3
Figure 3
Newly synthesized COPBI protein is reduced in mutant FUS expressing cells under stress. (A, B) Western blot analysis of immunoprecipitated COPBI from arsenite stressed SK-N-AS FUS WT and R495X cells. (A) Input lanes show similar levels of COPBI protein in cell lysates, whereas AHA-labeled COPBI protein is below the limit of detection in the whole cell lysate (the shadow of a band at the top of the image corresponds to a protein of higher molecular weight than COPBI) (left). Anti-COPBI antibody (top) confirms that similar levels of COPBI were isolated from the FUS WT and R495X lysates (right). Immunoblotting the same blot with a streptavidin secondary antibody against biotin-conjugated AHA-labeled proteins (bottom) shows this band contains less newly synthesized COPBI protein in FUS R495X cells under arsenite (SA) stress. (B) Quantification of (A), n = 3 independent biological experiments (Student’s t-test, **P = 0.002). (C, D) Western analysis of neurons derived from transgenic FUS R495X (RX) mice and NTG littermates. (C) Representative Western blot with anti-COPBI and anti-TUBB3 (Tuj1; loading control) antibodies. (D) Quantification of (C), 3 biological experiments. (E–G) Western analysis of other COPI subunits. (E) Representative Western blot of NTG and FUS R495X neurons with anti-COPA, COPGI and TUJ1 antibodies. (F, G) Quantification of (E), 3 or 4 biological experiments for (F) and (G), respectively. (H) Quantitative PCR analysis of COPBI mRNA levels in NTG and FUS R495X neurons (4 biological experiments). (D, F–H) Data were analyzed by two-way ANOVA with Tukey post hoc testing for multiple comparisons, and error bars reflect standard error of the mean. Statistically significant comparisons are represented by *P < 0.05, **P < 0.01 and ***P < 0.001. All significant comparisons are shown.
Figure 4
Figure 4
COPBI dispersion and Golgi fragmentation in mutant FUS expressing primary neurons with and without stress. (A, B) Representative immunofluorescence micrographs of NTG control and FUS R495X (RX)-expressing neurons probed with antibodies against the stress granule marker TIAR, FUS and COPBI, and counterstained with DAPI to highlight the nucleus. For clarity, TIAR, FUS and COPBI signals are shown individually in black and white micrographs (left). Pseudo-colored images of FUS (red), COPBI (green) and DAPI (blue) overlaid at low and high magnification highlight COPBI dispersion in unstressed R495X neurons, as well as in stressed NTG and R495X neurons. Dashed boxes denote cells that are shown at high magnification (right). Low magnification scale bar, 20um; high magnification scale bar, 5um. (C) Significantly more M511Nfs neurons exhibited a disperse COPBI phenotype [as exemplified in (A) and (B)] than M511Nfs*Cor neurons in the absence of stress (*P < 0.05 by two-way ANOVA with Tukey post hoc testing). Additional significant comparisons include all unstressed versus all stressed conditions (not shown for clarity). (D,E) Representative Western blot and quantification of FUS levels in M511Nfs*Cor and M511Nfs MNs from three independent differentiations. (*P < 0.05 by Student’s t-test).
Figure 5
Figure 5
Enhanced COPBI dispersion is detected in human iPSC-derived neurons expressing endogenous levels of ALS-linked FUS. (A, B) Representative immunofluorescence micrographs of iPSC-derived neurons expressing the ALS-linked FUS M511 fs variant or derived from the CRISPR-Cas9 corrected line (M511 fs*cor). All neurons are TUJ-1 positive (not shown). Neurons were probed with antibodies against FUS and COPBI, and counterstained with DAPI to highlight the nucleus. FUS and COPBI signals are shown individually in black and white micrographs (left). Pseudo-colored images of FUS (red), COPBI (green) and DAPI (blue) overlaid at low and high magnification are shown at the right. Dashed boxes denote cells that are shown at high magnification (right). Low magnification scale bar, 15 μm; high magnification scale bar, 5 μm. C. Significantly more R495X neurons exhibited a disperse COPBI phenotype [as exemplified in (A) and (B)] than NTG neurons in the absence of stress (**P < 0.01 by two-way ANOVA with Tukey post hoc testing). Additional significant comparisons include all unstressed versus all stressed conditions (not shown for clarity). (D) Representative immunofluorescence micrographs for unstressed and stressed neurons probed with anti-COPBI (green) and anti-GM130 (red). Scale bar, 10 μm. (E) Representative Western blot and quantification of FUS levels in M511Nfs*Cor and M511Nfs MNs from three independent differentiations (*P < 0.05 by Student’s t-test).
Figure 6
Figure 6
Golgi to ER transport is delayed in mutant FUS expressing cells. (A) Representative immunofluorescence micrographs of FUS WT and R495X SK-N-AS cells transfected with the retrograde transport reporter, VSVGts045-KDELR-YFP, at various time points throughout the transport assay. Cells were probed with anti-GFP (green) and anti-GM130 (red) antibodies, to amplify the YFP signal and highlight the Golgi, respectively. Note the high degree of overlap between the GFP/YFP and Golgi signals at the start of the assays and still at 20 min for FUS R495X cells. Scale bar, 12um. (B) The percent (%) co-localization between GM130 and GFP/YFP (VSVG) was quantified for 3 biological experiments, revealing a statistically significant difference between FUS WT and R495X cells at the 20 min time point (**P < 0.01 by two-way ANOVA with Tukey post hoc testing). Data was collected at either 40 or 45 min; data were grouped for this time point, as the results were similar. Additional significant comparisons were uncovered between the 0, 20 and 40/45 min time points but were not labeled for simplicity.

Similar articles

Cited by

References

    1. Holcik M. and Sonenberg N. (2005) Translational control in stress and apoptosis. Nat. Rev. Mol. Cell Biol., 6, 318–327. - PubMed
    1. Aulas A., Fay M.M., Lyons S.M., Achorn C.A., Kedersha N., Anderson P. and Ivanov P. (2017) Stress-specific differences in assembly and composition of stress granules and related foci. J. Cell Sci., 130, 927–937. - PMC - PubMed
    1. Protter D.S. and Parker R. (2016) Principles and properties of stress granules. Trends Cell Biol., 26, 668–679. - PMC - PubMed
    1. Souquere S., Mollet S., Kress M., Dautry F., Pierron G. and Weil D. (2009) Unravelling the ultrastructure of stress granules and associated P-bodies in human cells. J. Cell Sci., 122, 3619–3626. - PubMed
    1. Gomes E. and Shorter J. (2018) The molecular language of membraneless organelles. J. Biol. Chem., in press. - PMC - PubMed

Publication types

MeSH terms