. 2019 Apr 5;18(4):1582-1594.
doi: 10.1021/acs.jproteome.8b00886. Epub 2019 Mar 15.

Proteomic Analysis Reveals Novel Mechanisms by Which Polychlorinated Biphenyls Compromise the Liver Promoting Diet-Induced Steatohepatitis

Affiliations

Proteomic Analysis Reveals Novel Mechanisms by Which Polychlorinated Biphenyls Compromise the Liver Promoting Diet-Induced Steatohepatitis

Josiah E Hardesty et al. J Proteome Res. .

Abstract

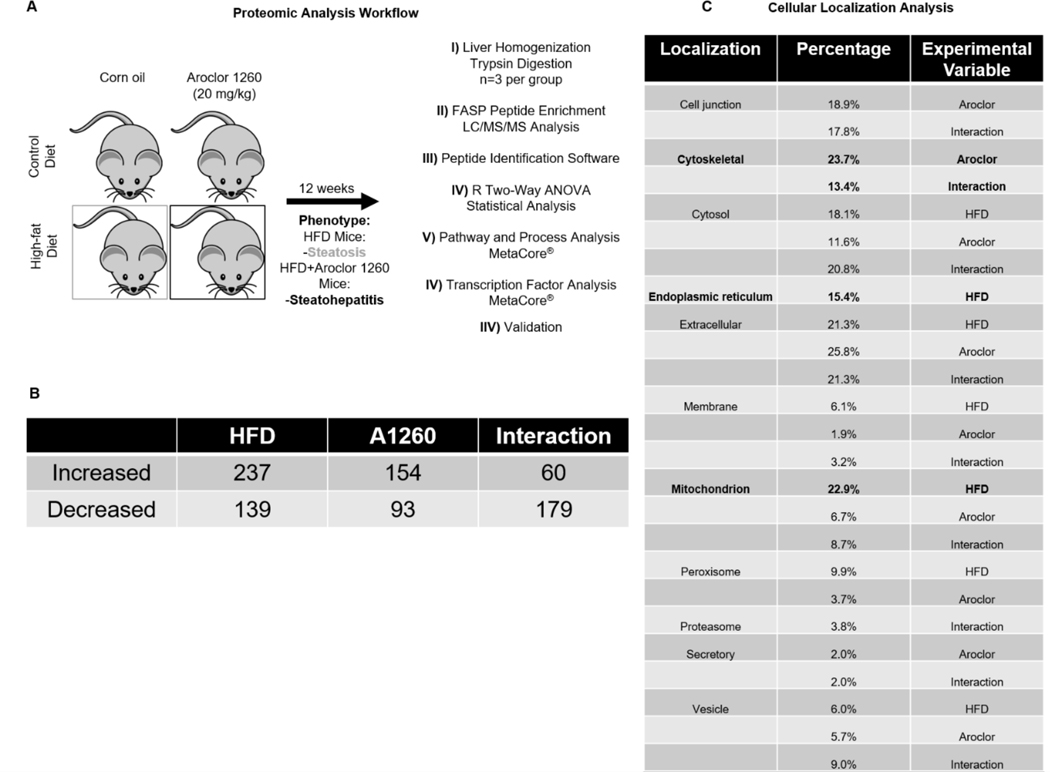
Environmental pollution contributes to fatty liver disease pathogenesis. Polychlorinated biphenyl (PCB) exposures have been associated with liver enzyme elevation and suspected steatohepatitis in cohort studies. Male mice treated with the commercial PCB mixture, Aroclor 1260 (20 mg/kg), and fed high fat diet (HFD) for 12 weeks developed steatohepatitis. Receptor-based modes of action including inhibition of the epidermal growth factor (EGF) receptor were previously proposed, but other mechanisms likely exist. Objectives were to identify and validate the pathways, transcription factors, and mechanisms responsible for the steatohepatitis associated with PCB and HFD coexposures. Comparative proteomics analysis was performed in archived mouse liver samples from the aforementioned chronic exposure study. Pathway and transcription factor analysis (TFA) was performed, and selected results were validated. Liver proteomics detected 1103 unique proteins. Aroclor 1260 upregulated 154 and downregulated 93 of these. Aroclor 1260 + HFD coexposures affected 55 pathways including glutathione metabolism, intermediary metabolism, and cytoskeletal remodeling. TFA of Aroclor 1260 treatment demonstrated alterations in the function of 42 transcription factors including downregulation of NRF2 and key nuclear receptors previously demonstrated to protect against steatohepatitis (e.g., HNF4α, FXR, PPARα/δ/γ, etc.). Validation studies demonstrated that Aroclor 1260 significantly reduced HNF4α protein levels, while Aroclor 1260 + HFD reduced expression of the HNF4α target gene, albumin, in vivo. Aroclor 1260 attenuated EGF-dependent HNF4α phosphorylation and target gene activation in vitro. Aroclor 1260 reduced levels of NRF2, its target genes, and glutathione in vivo. Aroclor 1260 attenuated EGF-dependent NRF2 upregulation, in vitro. Aroclor 1260 indirectly activated hepatic stellate cells in vitro via induction of hepatocyte-derived TGFβ. PCB exposures adversely impacted transcription factors regulating liver protection, function, and fibrosis. PCBs, thus, compromised the liver by reducing its protective responses against nutritional stress to promote diet-induced steatohepatitis. The identified mechanisms by which environmental pollutants influence fatty liver disease pathogenesis require confirmation in humans.

Keywords: Aroclor 1260; EGFR; HNF4α; TASH; liver; metabolism; polychlorinated biphenyl; steatohepatitis.


Figures

Figure 1:
Figure 1:. Liver proteomic analysis identifies protein alterations due to HFD, Aroclor 1260, and their interaction in a mouse model of fatty liver disease.
A. Proteomic analysis workflow of mouse liver samples. B. Significant (p=0.05) differential abundances of hepatic proteins due to a HFD, Aroclor 1260 exposure, and their interaction. A complete list of significant results is provided in Supporting Information Tables S2A–C. Cellular localization of the significant proteins for each variable. Three biological replicates per group was used for the proteomic analysis (12 in total). Peptide abundances were compared by two-way ANOVA, and only peptides that were significant (p<0.05) were investigated further.
Figure 2:
Figure 2:. Pathway analysis of proteins altered by either a HFD, Aroclor 1260 exposure or their interaction.
A, –Log(p-value) plots and pathway analysis of proteins significantly altered by HFD; B, Aroclor exposure; or C, their interaction. The complete list of altered pathways and processes are provided in Supporting Information Tables S3A–F. All pathways and processes identified through MetaCore analysis had to meet a FDR threshold <0.05.
Figure 3:
Figure 3:. Aroclor 1260 reduced HNF4α protein expression and activity, and HNF4α is a downstream phosphorylation target of the EGFR inhibited by PCBs.
A. (i) Immunoblot analysis, and (ii) RT qPCR analysis of hepatic HNF4α protein and mRNA from mice fed a control diet (CD), control diet and exposed to Aroclor 1260 (20 mg/kg) (CD+), fed a HFD (HFD), and fed a HFD and exposed to Aroclor 1260 (20 mg/kg) (HFD+). B. RT qPCR Analysis of HNF4α target genes (i) Albumin, (ii) Cyp2c29, and (iii) Ttpa from murine liver. C. Western blot analysis of (i) Y1173 EGFR and (ii) HNF4α S313 phosphorylation in AML-12 cell lysates exposed to DMSO (0.1%), EGF (1.2 nM), and EGF+A1260 (1.2 nM EGF, 10 μg/mL). D. RT qPCR analysis of HNF4α target gene Pklr in AML-12s after 6-hour incubation with either DMSO (0.1%), EGF (1.2 nM), EGF+A1260 (1.2nM EGF, 10 μg/mL), or A1260 (10 μg/mL). All data are represented as box and whisker plots. An n=5 was used for the HNF4α protein levels analysis in vivo, an n=10 for Hnf4α mRNA and HNF4α target gene mRNA in vivo, an n=4 for HNF4α S313 phosphorylation, and an n=4 for Pklr mRNA. A P<0.05 is denoted with *. In the in vivo datasets an a denotes significance due to Aroclor, b HFD, and c interaction. Two-way ANOVA was used to statistically compare the in vivo data. One-way ANOVA was used for the statistical analysis for Fig 3Ci-ii. A two-way ANOVA was used for the statistical analysis in Fig 3D; an a denotes significance due to EGF, b due to Aroclor 1260.
Figure 4:
Figure 4:. Aroclor 1260 reduced NRF2 protein/mRNA expression and glutathione levels, and NRF2 is an EGF-sensitive target negatively impacted by PCBs.
A. (i) Immunoblot analysis, (ii) RT qPCR of hepatic NRF2 protein and mRNA, respectively, and total glutathione measurements from mice fed a control diet (CD), control diet and exposed to Aroclor 1260 (20 mg/kg) (CD+), a HFD (HFD), and HFD and exposed to Aroclor 1260 (20 mg/kg) (HFD+). B. RT qPCR analysis of hepatic NRF2 target genes (i) Nqo1, (ii), Gstm1, (iii) Me1, and (iv) Gclc in murine liver. C. (i) Immunoblot analysis of NRF2 protein stability in A-431 cells exposed to either DMSO (0.1%), EGF (1.2 nM), EGF+A1260 (1.2nM EGF, 10 μg/mL), or A1260 (10 μg/mL) for 2 hours. A p<0.05 is denoted by a for Aroclor, b for HFD/EGF or c for interaction in the in vivo datasets. All data are represented as box and whisker plots. A sample size of 5 was used for the analysis of the NRF2 protein levels in vivo, an n=10 for NRF2 mRNA and NRF2 target gene mRNA in vivo. An n=4 was used for the NRF2 in vitro assay and an a denotes significance due to EGF and c for interaction. Statistical significance was determined by two-way ANOVA.
Figure 5:
Figure 5:. Aroclor exposure activates HSCs through hepatocyte-derived TGF-β
A. RT qPCR analysis of (i) ACTA2 and (ii) PLIN2 in LX-2 cells directly exposed to either DMSO (0.1%) or A1260 (10 μg/mL) for 24 or 48 hours. B. RT qPCR analysis of (i) ACTA2 and (ii) PLIN2 in LX-2 cells exposed to HepG2 media from HepG2 cells exposed to either DMSO (0.1%) or A1260 (10 μg/mL) for 24 hours. C. Gene expression analysis of (i) PDGFα and (ii) TGF-β in HepG2 cells directly exposed to either DMSO (0.1%) or A1260 (10 μg/mL) for 24 hours. D. RT qPCR analysis of MEF2C in murine liver of mice fed a control or HFD with either exposure to Aroclor 1260 (20 mg/kg) or vehicle control, denoted as CD, CD+, HFD, HFD+. For in vitro studies, p<0.05 is denoted with *, p<0.01 **. For in vivo studies, a p<0.05 is denoted by a for Aroclor, b for HFD or c for interaction. A n=4 was used for figure 5A-C, n=10 for figure 5D and the data are presented as box and whisker plots. A two-tailed t-test was used to statistically compare datasets Fig 5A-C and a two-way ANOVA for 5D.

References

    1. Younossi ZM; Koenig AB; Abdelatif D; Fazel Y; Henry L; Wymer M, Global epidemiology of nonalcoholic fatty liver disease-Meta-analytic assessment of prevalence, incidence, and outcomes. Hepatology 2016, 64, (1), 73–84. - PubMed
    1. Heindel JJ.; Blumberg B.; Cave M.; Machtinger R.; Mantovani A.; Mendez MA.; Nadal A.; Palanza P.; Panzica G.; Sargis R.; Vandenberg LN.; Vom Saal F., Metabolism disrupting chemicals and metabolic disorders. Reprod Toxicol 2017, 68, 3–33. - PMC - PubMed
    1. Lang AL; Beier JI, Interaction of volatile organic compounds and underlying liver disease: a new paradigm for risk. Biol Chem 2018, 399, (11), 1237–1248. - PMC - PubMed
    1. Wahlang B; Beier JI; Clair HB; Bellis-Jones HJ; Falkner KC; McClain CJ; Cave MC, Toxicant-associated steatohepatitis. Toxicol Pathol 2013, 41, (2), 343–60. - PMC - PubMed
    1. Foulds CE; Trevino LS; York B; Walker CL, Endocrine-disrupting chemicals and fatty liver disease. Nat Rev Endocrinol 2017, 13, (8), 445–457. - PMC - PubMed

Publication types