Mechanism-Based Modeling of Tumor Growth and Treatment Response Constrained by Multiparametric Imaging Data
- PMID: 30807209
- PMCID: PMC6535803
- DOI: 10.1200/CCI.18.00055
Mechanism-Based Modeling of Tumor Growth and Treatment Response Constrained by Multiparametric Imaging Data
Abstract
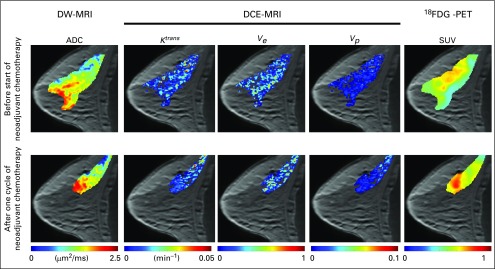
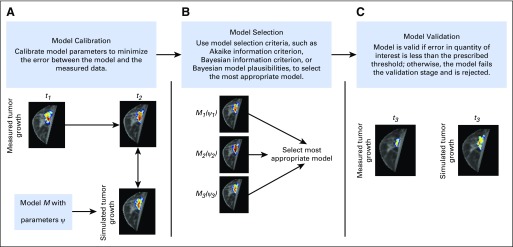
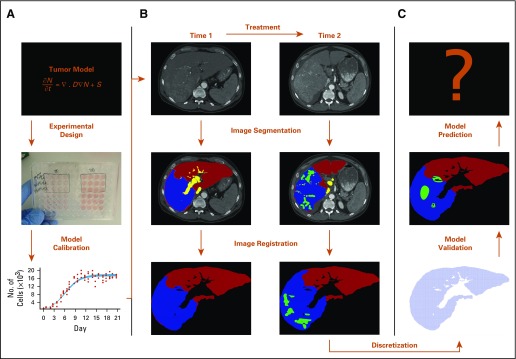
Multiparametric imaging is a critical tool in the noninvasive study and assessment of cancer. Imaging methods have evolved over the past several decades to provide quantitative measures of tumor and healthy tissue characteristics related to, for example, cell number, blood volume fraction, blood flow, hypoxia, and metabolism. Mechanistic models of tumor growth also have matured to a point where the incorporation of patient-specific measures could provide clinically relevant predictions of tumor growth and response. In this review, we identify and discuss approaches that use multiparametric imaging data, including diffusion-weighted magnetic resonance imaging, dynamic contrast-enhanced magnetic resonance imaging, diffusion tensor imaging, contrast-enhanced computed tomography, [18F]fluorodeoxyglucose positron emission tomography, and [18F]fluoromisonidazole positron emission tomography to initialize and calibrate mechanistic models of tumor growth and response. We focus the discussion on brain and breast cancers; however, we also identify three emerging areas of application in kidney, pancreatic, and lung cancers. We conclude with a discussion of the future directions for incorporating multiparametric imaging data and mechanistic modeling into clinical decision making for patients with cancer.
Conflict of interest statement
The following represents disclosure information provided by authors of this manuscript. All relationships are considered compensated. Relationships are self-held unless noted. I = Immediate Family Member, Inst = My Institution. Relationships may not relate to the subject matter of this manuscript. For more information about ASCO's conflict of interest policy, please refer to
No potential conflicts of interest were reported.
Figures
Similar articles
-
A multiparametric [18F]FDG PET/MRI diagnostic model including imaging biomarkers of the tumor and contralateral healthy breast tissue aids breast cancer diagnosis.Eur J Nucl Med Mol Imaging. 2019 Aug;46(9):1878-1888. doi: 10.1007/s00259-019-04331-6. Epub 2019 Jun 13. Eur J Nucl Med Mol Imaging. 2019. PMID: 31197455 Free PMC article. Clinical Trial.
-
Multiparametric MRI and 18F-FDG PET features for differentiating gastrointestinal stromal tumors from benign gastric subepithelial lesions.Eur Radiol. 2020 Mar;30(3):1634-1643. doi: 10.1007/s00330-019-06534-9. Epub 2019 Nov 28. Eur Radiol. 2020. PMID: 31781931
-
18F-Fluorodeoxyglucose Positron Emission Tomography/Magnetic Resonance in Lymphoma: Comparison With 18F-Fluorodeoxyglucose Positron Emission Tomography/Computed Tomography and With the Addition of Magnetic Resonance Diffusion-Weighted Imaging.Invest Radiol. 2016 Mar;51(3):163-9. doi: 10.1097/RLI.0000000000000218. Invest Radiol. 2016. PMID: 26784400 Free PMC article.
-
Therapy response evaluation with positron emission tomography-computed tomography.Semin Ultrasound CT MR. 2010 Dec;31(6):490-5. doi: 10.1053/j.sult.2010.10.007. Semin Ultrasound CT MR. 2010. PMID: 21147376 Review.
-
Positron emission tomography-computed tomography protocols for radiation therapy planning and therapy response assessment.Semin Ultrasound CT MR. 2010 Dec;31(6):468-79. doi: 10.1053/j.sult.2010.10.008. Semin Ultrasound CT MR. 2010. PMID: 21147374 Review.
Cited by
-
Mechanistic modeling of cell viability assays with in silico lineage tracing.PLoS Comput Biol. 2025 Aug 29;21(8):e1013156. doi: 10.1371/journal.pcbi.1013156. eCollection 2025 Aug. PLoS Comput Biol. 2025. PMID: 40880521 Free PMC article.
-
From virtual patients to digital twins in immuno-oncology: lessons learned from mechanistic quantitative systems pharmacology modeling.NPJ Digit Med. 2024 Jul 16;7(1):189. doi: 10.1038/s41746-024-01188-4. NPJ Digit Med. 2024. PMID: 39014005 Free PMC article. Review.
-
Introduction to Mathematical Oncology.JCO Clin Cancer Inform. 2019 Apr;3:1-4. doi: 10.1200/CCI.19.00010. JCO Clin Cancer Inform. 2019. PMID: 31026176 Free PMC article. No abstract available.
-
Mechanistic modeling of cell viability assays with in silico lineage tracing.bioRxiv [Preprint]. 2024 Aug 26:2024.08.23.609433. doi: 10.1101/2024.08.23.609433. bioRxiv. 2024. Update in: PLoS Comput Biol. 2025 Aug 29;21(8):e1013156. doi: 10.1371/journal.pcbi.1013156. PMID: 39253474 Free PMC article. Updated. Preprint.
-
Image-based personalization of computational models for predicting response of high-grade glioma to chemoradiation.Sci Rep. 2021 Apr 19;11(1):8520. doi: 10.1038/s41598-021-87887-4. Sci Rep. 2021. PMID: 33875739 Free PMC article.
References
-
- Therasse P, Arbuck SG, Eisenhauer EA, et al. New guidelines to evaluate the response to treatment in solid tumors. European Organization for Research and Treatment of Cancer, National Cancer Institute of the United States, National Cancer Institute of Canada. J Natl Cancer Inst. 2000;92:205–216. - PubMed
-
- Eisenhauer EA, Therasse P, Bogaerts J, et al. New Response Evaluation Criteria in Solid Tumours: Revised RECIST guideline (version 1.1) Eur J Cancer. 2009;45:228–247. - PubMed
Publication types
MeSH terms
Substances
Grants and funding
LinkOut - more resources
Full Text Sources
Medical
Miscellaneous