. 2019 Jul 1:1714:99-110.
doi: 10.1016/j.brainres.2019.02.027. Epub 2019 Feb 23.

Sweet and bitter taste stimuli activate VTA projection neurons in the parabrachial nucleus

Affiliations

Sweet and bitter taste stimuli activate VTA projection neurons in the parabrachial nucleus

John D Boughter Jr et al. Brain Res. .

Abstract

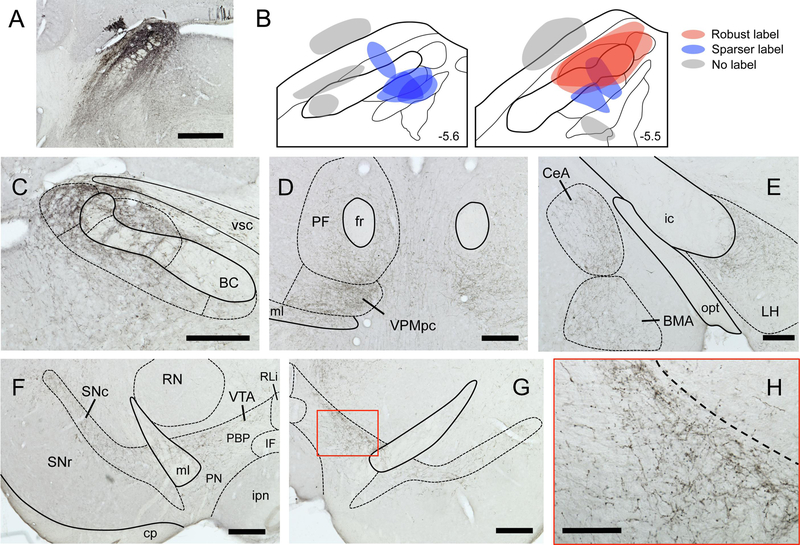
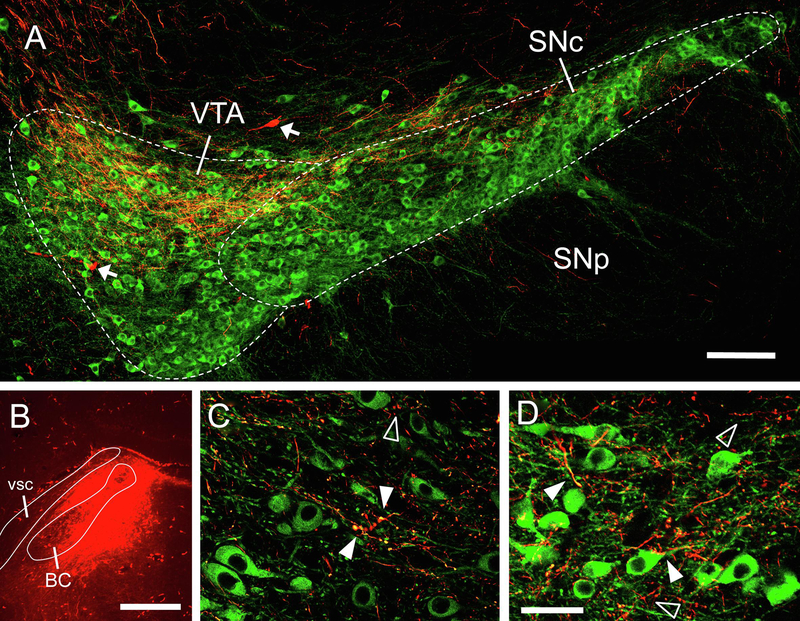
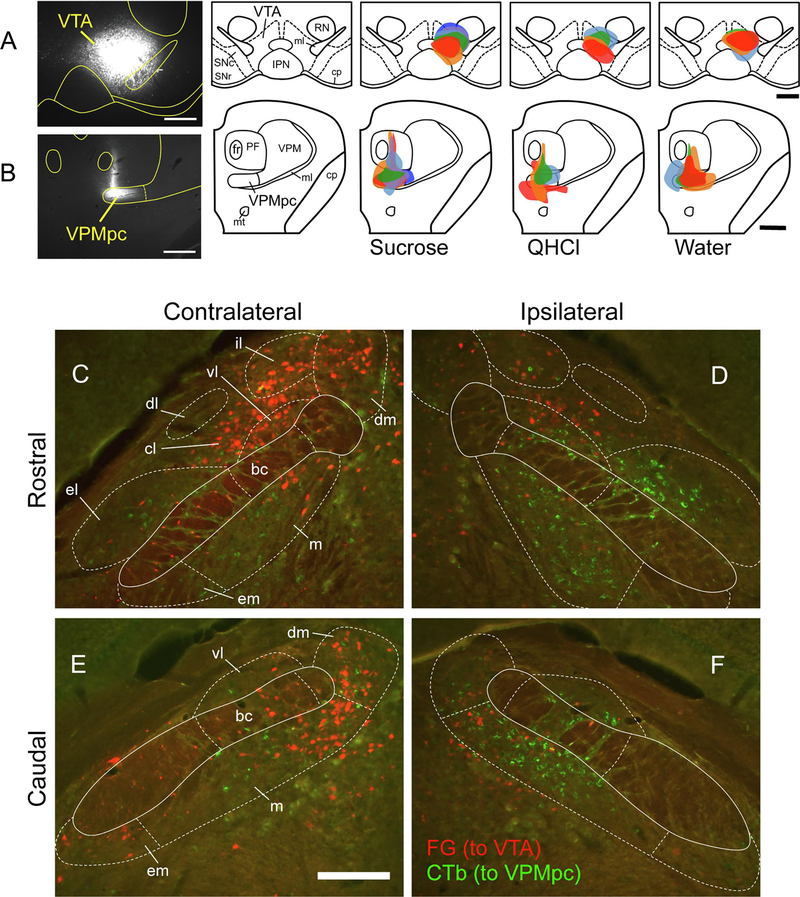
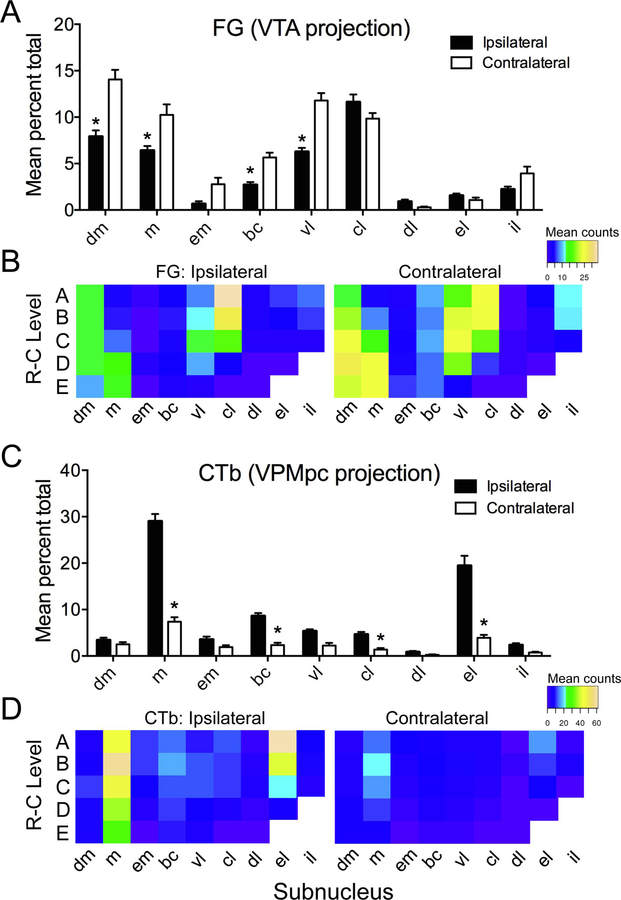
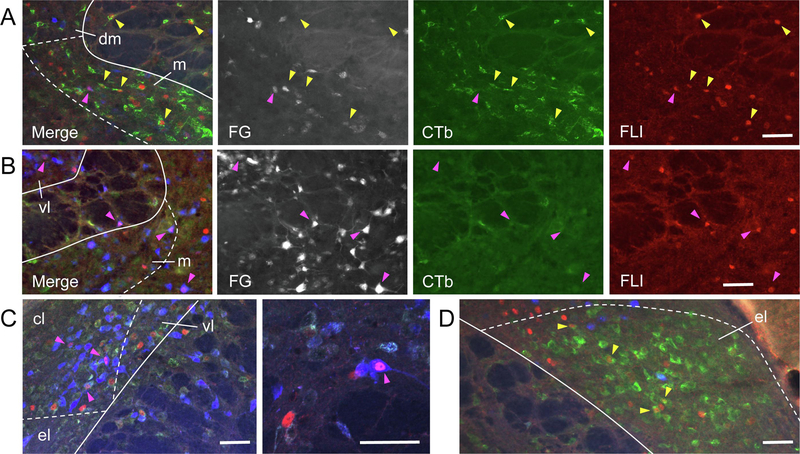
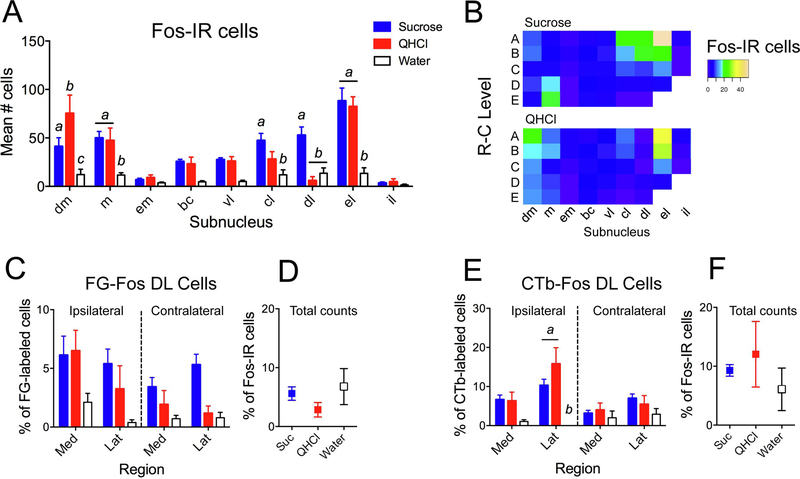
This study investigated neural projections from the parabrachial nucleus (PBN), a gustatory and visceral processing area in the brainstem, to the ventral tegmental area (VTA) in the midbrain. The VTA contains a large population of dopaminergic neurons that have been shown to play a role in reward processing. Anterograde neural tracing methods were first used to confirm that a robust projection from the caudal PBN terminates in the dorsal VTA; this projection was larger on the contralateral side. In the next experiment, we combined dual retrograde tracing from the VTA and the gustatory ventral posteromedial thalamus (VPMpc) with taste-evoked Fos protein expression, which labels activated neurons. Mice were stimulated through an intraoral cannula with sucrose, quinine, or water, and PBN sections were processed for immunofluorescent detection of Fos and retrograde tracers. The distribution of tracer-labeled PBN neurons demonstrated that the populations of cells projecting to the VTA or VPMpc are largely independent. Quantification of cells double labeled for Fos and either tracer demonstrated that sucrose and quinine were effective in activating both pathways. These results indicate that information about both appetitive and aversive tastes is delivered to a key midbrain reward interface via direct projections from the PBN.

Keywords: Fos; Neuroanatomy; Pathway; Reward; Taste; Tracer.


Figures

Figure 1
Figure 1
Delineation of the PBN at 5 levels along the rostral-caudal axis of the mouse brain. Sections were nissl-stained with cresyl violet to reveal cytoarchitecture. This span of sections (40 μm thickness) is spaced out evenly over a 360 μm distance, starting at the most rostral section (A), approximately –5.24 mm relative to bregma. Sections are ordered A-E, from rostral to most caudal. PBN subnuclei are labeled as follows: dm, dorsal medial; m, medial; em, external medial; bc, brachium conjunctivum; vl, ventral lateral; cl, central lateral; dl, dorsal lateral; el, external lateral; il, internal lateral. All pictures at same magnification, scale bar in A = 100 μm. Other abbreviations are: vsc, ventral spinocerebellar tract; Me5, mesencephalic trigeminal nucleus; LC, locus coeruleus; KF, kolliker-fuse nucleus.
Figure 2
Figure 2
Anterograde tracing from PBN reveals projections to taste-associated brain areas. A. Representative image of BDA tracer injection site into caudal PBN. B. Approximate injection sites for 13 mice; those injections that infiltrated primarily lateral but also medial regions of PBN (red) produced the most robust label in upstream brain regions. Smaller, more restricted injections (blue) produced sparser labeling, while off-target injections (gray) produced no labeling. Characteristic terminal labeling is shown in the contralateral PBN (C), bilaterally in the medial thalamus (D), ipsilaterally in the amygdala and LH, and bilaterally in the SNc and VTA (F-G). VTA level is approximately - 3.2 mm from Bregma. Higher magnification view of contralateral VTA (red box in G) is shown in H. All micrographs are from a single animal. Delineations based on Allen Brain Atlas. Scale bars: A = 500 μm, C-G = 250 μm, H = 100 μm. Abbreviations in panel F delineating VTA subregions: PBP, parabrachial pigmented nucleus; PN, paranigral nucleus; IF, interfasicular nucleus; RLi, rostral linear nucleus.
Figure 3
Figure 3
Anterograde labeling from PBN in proximity to TH+ neurons in the contralateral VTA and SNc. A. lower power image shows fibers and terminals from PBN (red) intermingling with TH+ neurons, especially in the dorsal field of the VTA. Arrows show examples of retrogradely-labeled neurons. B. tracer injection site in the PBN. C-D. Higher magnification images (same animal as A, but different images) show areas of overlap between anterograde-labeled terminal processes (red) and TH+ cell bodies and dendritic processes (green – examples of overlap indicated by solid arrowheads). In other places, terminal processes do not overlap with TH+ elements (open arrowheads). AP level in VTA images approximately −2.8 mm from bregma, delineation based on Allen Brain Atlas. Scale bars: A = 100 μm, B = 500 μm, C-D = 20 μm.
Figure 4
Figure 4
VTA and VPMpc injection sites, and neuronal cell body labeling in the PBN. A. Representative photomicrograph of VTA injection site, and plots of injection site and size in the VTA for each animal according to stimulus group. B. Representative photomicrograph of VPMpc injection site, and plots of injection site and size in the VPMpc for each animal according to stimulus group. Colors identify single animals within each group, consistent for injections at both brain sites. C-F: Tracer labeling in the PBN. Low-power (10X) Fluorescent images taken from both sides of 2 brain sections from a single mouse, with rostral (top) and caudal (bottom) levels of the PBN shown. Retrograde FG labeling (red) from the VTA was stronger on the contralateral side, whereas retrograde CTb labeling (green) was stronger on the ipsilateral side. In these images, Fos-IR cells are not shown. Scale bars: A-B = 500 μm, E = 200 μm.
Figure 5
Figure 5
Quantification of FG and CTb retrogradely-labeled cells in the PBN by subnucleus and according to rostral-caudal (RC) level. A. Mean number (expressed as % of total) of FG (VTA-projecting) neurons, combined across stimulus groups, varied according to both subnuclear location and side of the brain. B. Heat maps show relative numbers of FG-labeled cells in each subnucleus at each of 5 RC levels on either side. C-D. Similar plots and heat maps are shown for CTb (VPMpc-projecting) neurons. Asterisks in A,C show significant ipsilateral-contralateral differences in particular subnuclei (p < 0.05).
Figure 6
Figure 6
Examples of FG, CTb, and FLI (Fos-like immunoreactivity) labeling in the PBN, shown as both merged images, as well as individual channels for each fluorophore (FG, colored blue in the merged image, is shown more clearly in grayscale). A. Several cells doubled-labeled for CTb and sucrose-evoked FLI (yellow arrowheads) are found in the ipsilateral, caudal PBN in the medial (m) subnucleus. B. Cells double-labeled for FG and sucrose-evoked FLI (pink arrowheads) in m and ventral lateral (vl) subnuclei on the contralateral side in a more rostral level of the PBN. C. Cells double-labeled for FG and quinine-evoked FLI in the central lateral (cl) subnucleus in the contralateral, rostral PBN; High-magnification image from same animal shown in second panel. D. Robust expression of CTb and sucrose-evoked FLI in the ipsilateral external lateral (el) subnucleus. Scale bars = 100 μm.
Figure 7
Figure 7
Quantification of Fos-IR and double-labeled (DL) cells. A. Mean number of Fos-IR cells according to stimulus and subnucleus. B. Heat maps show relative number of Fos-IR cells in each subnucleus at each of 5 RC levels, for either sucrose (top) or QHCl (bottom; water not shown). C. FG-Fos DL cells, expressed as a percentage of FG-labeled cells in each region and on each side. D. Total FG-Fos DL cells, expressed as a percentage of Fos-IR cells. E-F: Same measurements as in C-D, except for CTb-Fos DL cells. Letters denote statistically significant groups in post-hoc tests (p < 0.05).

Similar articles

Cited by

References

    1. Bachmanov AA, Tordoff MG, Beauchamp GK (2001). Sweetener preference of C57BL/6ByJ and 129P3/J mice. Chem Senses, 26, 905–913. - PMC - PubMed
    1. Bamji-Stocke S, Biggs BT, Samuelsen CL (2018) Experience-dependent c-Fos expression in the primary chemosensory cortices of the rat. Brain Res, 1701, 189–195. - PMC - PubMed
    1. Bassareo V, De Luca AM, Di Chiara G (2002) Differential Expression of Motivational Stimulus Properties by Dopamine in Nucleus Accumbens Shell versus Core and Prefrontal Cortex. J. Neurosci 22, 4709–4719. - PMC - PubMed
    1. Beier KT, Steinberg EE, DeLoach KE, Xie S, Miyamichi K, Schwarz L, Gao XJ, Kremer EJ, Malenka RC, Luo L. (2015) Circuit Architecture of VTA Dopamine Neurons Revealed by Systematic Input-Output Mapping. Cell 162:622–34. - PMC - PubMed
    1. Berridge KC, Kringelbach ML. (2008) Affective neuroscience of pleasure: reward in humans and animals. Psychopharmacology 199:457–80. - PMC - PubMed

Publication types