Gene regulation of Sclerotinia sclerotiorum during infection of Glycine max: on the road to pathogenesis
- PMID: 30808300
- PMCID: PMC6390599
- DOI: 10.1186/s12864-019-5517-4
Gene regulation of Sclerotinia sclerotiorum during infection of Glycine max: on the road to pathogenesis
Abstract
Background: Sclerotinia sclerotiorum is a broad-host range necrotrophic pathogen which is the causative agent of Sclerotinia stem rot (SSR), and a major disease of soybean (Glycine max). A time course transcriptomic analysis was performed in both compatible and incompatible soybean lines to identify pathogenicity and developmental factors utilized by S. sclerotiorum to achieve pathogenic success.
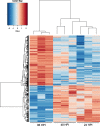
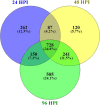
Results: A comparison of genes expressed during early infection identified the potential importance of toxin efflux and nitrogen metabolism during the early stages of disease establishment. The later stages of infection were characterized by an apparent shift to survival structure formation. Analysis of genes highly upregulated in-planta revealed a temporal regulation of hydrolytic and detoxification enzymes, putative secreted effectors, and secondary metabolite synthesis genes. Redox regulation also appears to play a key role during the course of infection, as suggested by the high expression of genes involved in reactive oxygen species production and scavenging. Finally, distinct differences in early gene expression were noted based on the comparison of S. sclerotiorum infection of resistant and susceptible soybean lines.
Conclusions: Although many potential virulence factors have been noted in the S. sclerotiorum pathosystem, this study serves to highlight soybean specific processes most likely to be critical in successful infection. Functional studies of genes identified in this work are needed to confirm their importance to disease development, and may constitute valuable targets of RNAi approaches to improve resistance to SSR.
Keywords: Effectors; Glycine max; Hydrolytic enzymes; Oxalic acid; Reactive oxygen species; Resistance; Sclerotinia sclerotiorum; Sclerotinia stem rot; Transcriptomics; White Mold.
Conflict of interest statement
Ethics approval and consent to participate
Not applicable.
Consent for publication
Not applicable.
Competing interests
The authors declare that they have no competing interests.
Publisher’s Note
Springer Nature remains neutral with regard to jurisdictional claims in published maps and institutional affiliations.
Figures


Similar articles
-
A Sclerotinia sclerotiorum Transcription Factor Involved in Sclerotial Development and Virulence on Pea.mSphere. 2019 Jan 23;4(1):e00615-18. doi: 10.1128/mSphere.00615-18. mSphere. 2019. PMID: 30674647 Free PMC article.
-
Changes in the Sclerotinia sclerotiorum transcriptome during infection of Brassica napus.BMC Genomics. 2017 Mar 29;18(1):266. doi: 10.1186/s12864-017-3642-5. BMC Genomics. 2017. PMID: 28356071 Free PMC article.
-
The pathogenic development of Sclerotinia sclerotiorum in soybean requires specific host NADPH oxidases.Mol Plant Pathol. 2018 Mar;19(3):700-714. doi: 10.1111/mpp.12555. Epub 2017 May 18. Mol Plant Pathol. 2018. PMID: 28378935 Free PMC article.
-
Sclerotinia sclerotiorum (Lib.) de Bary: Insights into the Pathogenomic Features of a Global Pathogen.Cells. 2023 Mar 31;12(7):1063. doi: 10.3390/cells12071063. Cells. 2023. PMID: 37048136 Free PMC article. Review.
-
Exploration of the Sclerotinia sclerotiorum-Brassica pathosystem: advances and perspectives in omics studies.Mol Biol Rep. 2024 Oct 26;51(1):1097. doi: 10.1007/s11033-024-10043-4. Mol Biol Rep. 2024. PMID: 39460825 Review.
Cited by
-
The bZIP transcription factor GmbZIP15 facilitates resistance against Sclerotinia sclerotiorum and Phytophthora sojae infection in soybean.iScience. 2021 May 24;24(6):102642. doi: 10.1016/j.isci.2021.102642. eCollection 2021 Jun 25. iScience. 2021. PMID: 34151234 Free PMC article.
-
The broad host range pathogen Sclerotinia sclerotiorum produces multiple effector proteins that induce host cell death intracellularly.Mol Plant Pathol. 2023 Aug;24(8):866-881. doi: 10.1111/mpp.13333. Epub 2023 Apr 10. Mol Plant Pathol. 2023. PMID: 37038612 Free PMC article.
-
Fungal biotechnology: From yesterday to tomorrow.Front Fungal Biol. 2023 Mar 27;4:1135263. doi: 10.3389/ffunb.2023.1135263. eCollection 2023. Front Fungal Biol. 2023. PMID: 37746125 Free PMC article. Review.
-
Transcriptome Analysis of the Necrotrophic Pathogen Alternaria brassicae Reveals Insights into Its Pathogenesis in Brassica juncea.Microbiol Spectr. 2023 Mar 13;11(2):e0293922. doi: 10.1128/spectrum.02939-22. Online ahead of print. Microbiol Spectr. 2023. PMID: 36912684 Free PMC article.
-
Identification of reference genes and their validation for gene expression analysis in phytopathogenic fungus Macrophomina phaseolina.PLoS One. 2022 Aug 5;17(8):e0272603. doi: 10.1371/journal.pone.0272603. eCollection 2022. PLoS One. 2022. PMID: 35930568 Free PMC article.
References
-
- Boland GJ, Hall R. Index of plant hosts of sclerotinia sclerotiorum. Can J Plant Pathol. 1994;16:93–108.
-
- Allen TW, Bradley CA, Sisson AJ, Coker CM, Dorrance AE, Esker PD, et al. Soybean Yield Loss Estimates Due to Diseases in the United States and Ontario, Canada, from 2010 to 2014. Plant Heal Prog. 2017;18:19–27.
-
- Mueller DS, Hartman GL, Pedersen WL. Development of sclerotia and apothecia of Sclerotinia sclerotiorum from infected soybean seed and its control by fungicide seed treatment. Plant Dis. 1999;83:1113–1115. - PubMed
-
- Adams P, Ayers WA. Ecology of Sclerotinia Species. Phytopathology. 1979;69:896–898.
-
- Wu BM, Subbarao KV. Effects of soil temperature, moisture, and burial depths on Carpogenic germination of Sclerotinia sclerotiorum and S. Minor. Phytopathology. 2008;98:1144–1152. - PubMed
MeSH terms
Substances
Grants and funding
LinkOut - more resources
Full Text Sources
Other Literature Sources
Molecular Biology Databases

