. 2019 Feb 26;13(1):24.
doi: 10.1186/s12918-019-0705-z.

Computational modelling of energy balance in individuals with Metabolic Syndrome

Affiliations

Computational modelling of energy balance in individuals with Metabolic Syndrome

Yvonne J W Rozendaal et al. BMC Syst Biol. .

Abstract

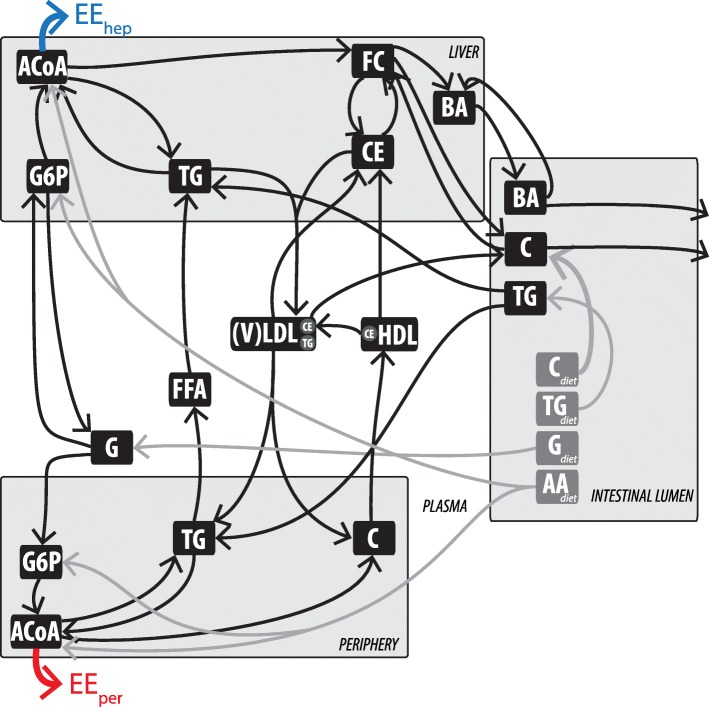
Background: A positive energy balance is considered to be the primary cause of the development of obesity-related diseases. Treatment often consists of a combination of reducing energy intake and increasing energy expenditure. Here we use an existing computational modelling framework describing the long-term development of Metabolic Syndrome (MetS) in APOE3L.CETP mice fed a high-fat diet containing cholesterol with a human-like metabolic system. This model was used to analyze energy expenditure and energy balance in a large set of individual model realizations.

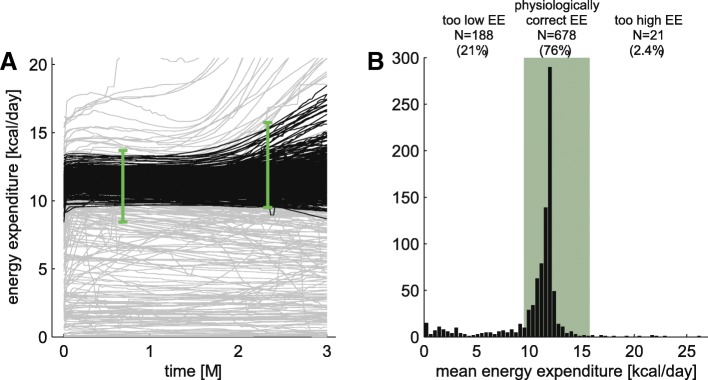
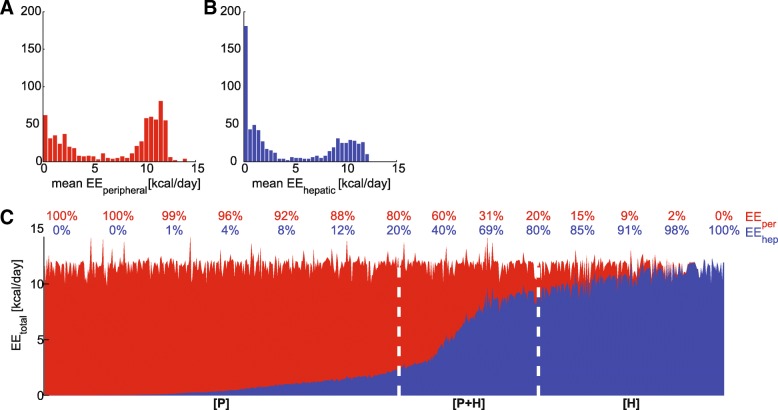
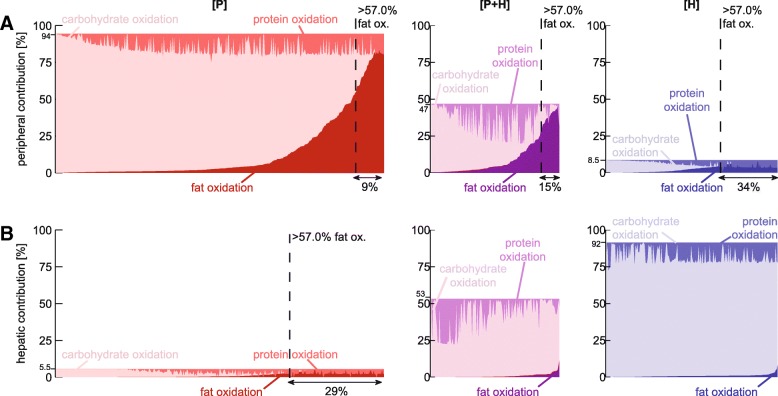
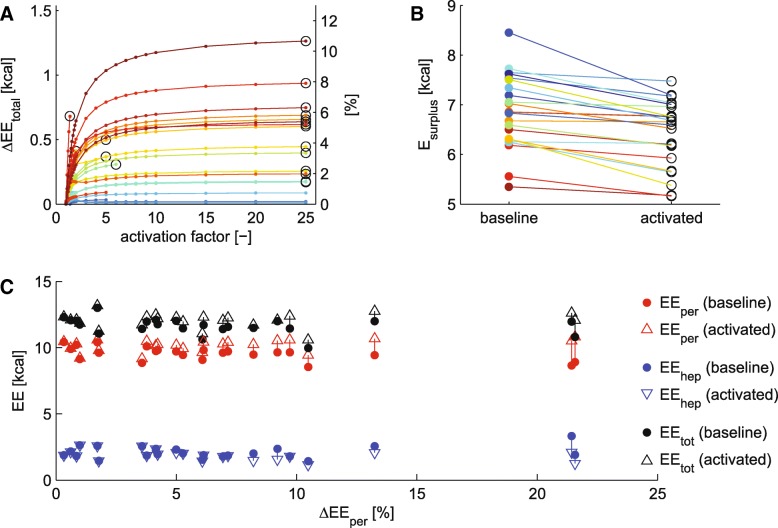
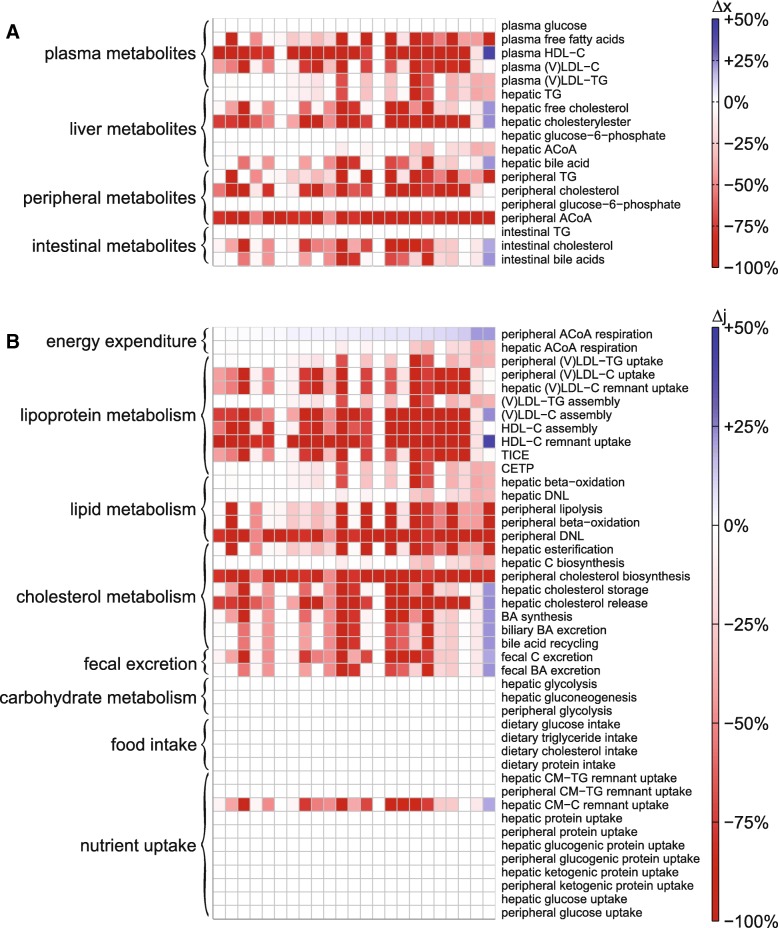
Results: We developed and applied a strategy to select specific individual models for a detailed analysis of heterogeneity in energy metabolism. Models were stratified based on energy expenditure. A substantial surplus of energy was found to be present during MetS development, which explains the weight gain during MetS development. In the majority of the models, energy was mainly expended in the peripheral tissues, but also distinctly different subgroups were identified. In silico perturbation of the system to induce increased peripheral energy expenditure implied changes in lipid metabolism, but not in carbohydrate metabolism. In silico analysis provided predictions for which individual models increase of peripheral energy expenditure would be an effective treatment.

Conclusion: The computational analysis confirmed that the energy imbalance plays an important role in the development of obesity. Furthermore, the model is capable to predict whether an increase in peripheral energy expenditure - for instance by cold exposure to activate brown adipose tissue (BAT) - could resolve MetS symptoms.

Keywords: Brown adipose tissue; Cold exposure; Computational modelling; Energy expenditure; Heterogeneity; Lipid metabolism; Metabolic syndrome; Obesity; Patient-specific.


Conflict of interest statement

Ethics approval and consent to participate

This animal study was performed in accordance with the regulations of Animal welfare and rights in the Netherlands (The Animals Act 2011). The Animal Ethics Committee of the Leiden University Medical Center, Leiden, The Netherlands approved all animal experiments and protocols. After 12-weeks dietary intervention, mice were euthanized by CO2 suffocation and blood was collected via cardiac puncture. Unconscious mice were perfused with ice-cold saline via the cardiac perfusion, and various organs were isolated for further analysis.

Consent for publication

Not applicable.

Competing interests

The authors declare that they have no competing interests.

Publisher’s Note

Springer Nature remains neutral with regard to jurisdictional claims in published maps and institutional affiliations.

Figures

Fig. 1
Fig. 1
Schematic overview of energy expenditure in the computational model MINGLeD. Energy expenditure takes place in both hepatic (indicated by the blue arrow) and peripheral (indicated by the red arrow) compartments. This model scheme was adapted with permission from [27]. This multi-compartment framework encompasses pathways in dietary absorption, hepatic, peripheral, and intestinal lipid metabolism, hepatic, and plasma lipoprotein metabolism and plasma, hepatic, and peripheral carbohydrate metabolism. The metabolite pools in the different tissue compartments are displayed in the black frames; the corresponding metabolic fluxes are represented using the arrows. The grey fluxes represent the dietary inflow in terms of the different macronutrients derived from the experimental data. AA, amino acid; ACAT, Acyl-coenzyme A:cholesterol acyltransferase; ACoA, Acetyl CoA; BA, bile acid; C, cholesterol; CE, cholesteryl ester; CEH, cholesterol ester hydrolase; CETP, cholesteryl ester transfer protein; CM, chylomicron; DNL, de novo lipogenesis; (F)C, (free) cholesterol; (F)FA, (free) fatty acid; G, glucose; G6P, glucose-6-phosphate; GNG, gluconeogenesis; HDL, high density lipoprotein; TG, triglyceride; TICE, transintestinal cholesterol absorption; (V)LDL, (very) low density lipoprotein
Fig. 2
Fig. 2
Energy expenditure predicted by MINGLeD as trajectories over time (a) and mean over time (b). a distribution of trajectories describing total energy expenditure. The trajectories that adhere to the physiological constraints (represented by the green error bars; see Table 1) are depicted in black; the unacceptable ones in grey. b histogram of the mean energy expenditure. The physiologically acceptable range is depicted in green and derived from the following inclusion criteria: -EE at t = 3w within three-weeks confidence interval, i.e. [8.4–13.7 kcal/day]; −EE at t = 10w within three-weeks confidence interval, i.e. [9.5–15.7 kcal/day]; −overall minimum EE above the lower bound of the 3w confidence interval, i.e. 8.4 kcal/day; −overall maximum EE below 20 kcal/day
Fig. 3
Fig. 3
Peripheral (red) and hepatic (blue) contribution of energy expenditure. a and b include histograms of the mean energy expenditure. c shows the relative contribution (numbers above graph) where each vertical line represents a single virtual individual. The division in subgroups [P], [P + H], and [H] is indicated by the white dashed lines
Fig. 4
Fig. 4
Contribution of carbohydrate and fat oxidation to the peripheral (a) and hepatic (b) energy expenditure. In subgroup [P] (left-hand side panels), energy is predominantly utilized in the periphery (> 80% originates from the peripheral compartment). In subgroup [H] (right-hand side panels), energy is predominantly utilized in the liver (> 80% originates from the hepatic compartment). Subgroup [P + H] (panels in the center) is an intermediate subgroup in which both periphery and liver contribute significantly (> 20% originates from peripheral compartment and > 20% originates from the liver). The dark colored areas (bottom right) correspond with fat oxidation, the medium colored areas (top left) indicate protein oxidation and the light areas (middle) specify carbohydrate oxidation. The dashed line bounds of the acceptable physiological range on the lipid oxidation ratio (at least 57% originates from lipid substrates). The fraction of individuals that adheres to this constraint is depicted below each graph
Fig. 5
Fig. 5
In silico activation of peripheral energy expenditure leads to an increase of total EE. a shows the absolute (left vertical axis) and relative (right vertical axis) change in total EE upon increasing activation factor. Each line depicts a different virtual individual where data are color-coded according to the maximally achieved increase in peripheral energy expenditure. For each virtual individual, the highest activation result (if yielding at least 0.1% increase in total EE) was used for further analysis and indicated by the black circle. b displays the resulting decrease of the energy surplus in the system. Results are color-coded based on (a). c presents the shift in peripheral (red), hepatic (blue) and total (black) EE from baseline (represented with dots) to in silico activation (represented with upward facing triangles for increasing values and downward triangles for decreasing values) versus the relative increase in peripheral EE (on the horizontal axis)
Fig. 6
Fig. 6
Increased peripheral energy expenditure affects metabolite pools (a) and metabolic fluxes (b) throughout the system. The impact of the activation is depicted as relative change using a heatmap for N = 23 virtual individuals (from left to right: increasing relative change of peripheral energy expenditure). The changes are color-coded such that decreases are shown in red and increases in blue, and according to intensity: a darker color indicates a stronger change in metabolite concentration than a lighter color. White indicates 0% change

References

    1. Romieu I, Dossus L, Barquera S, Blottière HM, Franks PW, Gunter M, et al. Energy balance and obesity: what are the main drivers? Cancer Causes Control. 2017;28:247–258. doi: 10.1007/s10552-017-0869-z. - DOI - PMC - PubMed
    1. Hill JO, Wyatt HR, Peters JC. Energy balance and obesity. Circulation. 2012;126:126–132. doi: 10.1161/CIRCULATIONAHA.111.087213. - DOI - PMC - PubMed
    1. Hamilton MT, Hamilton DG, Zderic TW. Role of low energy expenditure and sitting in obesity, metabolic syndrome, type 2 diabetes, and cardiovascular disease. Diabetes. 2007;56:2655–2667. doi: 10.2337/db07-0882. - DOI - PubMed
    1. Rodrigues CQD, Santos JAP, Quinto BMR, Marrocos MSM, Teixeira AA, Rodrigues CJO, et al. Impact of metabolic syndrome on resting energy expenditure in patients with chronic kidney disease. Clin Nutr ESPEN. 2016;15:107–113. doi: 10.1016/j.clnesp.2016.07.001. - DOI - PubMed
    1. Grundy SM, Brewer HB, Cleeman JI, Smith SC, Lenfant C. Definition of metabolic syndrome report of the National Heart, Lung, and Blood Institute/American Heart Association Conference on scientific issues related to definition. Circulation. 2004;109:433–438. doi: 10.1161/01.CIR.0000111245.75752.C6. - DOI - PubMed

Publication types