Comparative Study
. 2019 Feb 26;20(1):45.
doi: 10.1186/s13059-019-1642-2.

Identification of transcription factor binding sites using ATAC-seq

Affiliations
Comparative Study

Identification of transcription factor binding sites using ATAC-seq

Zhijian Li et al. Genome Biol. .

Abstract

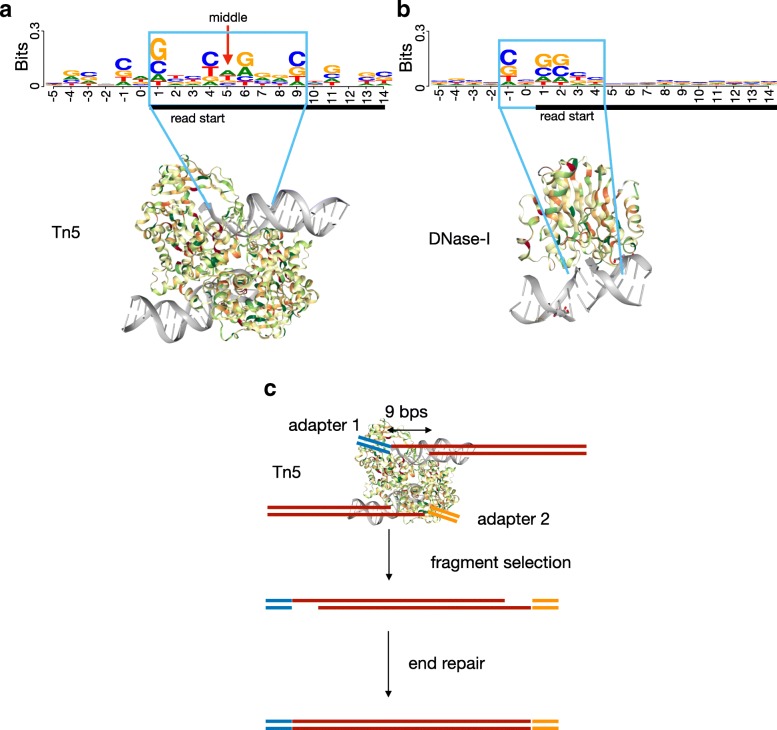
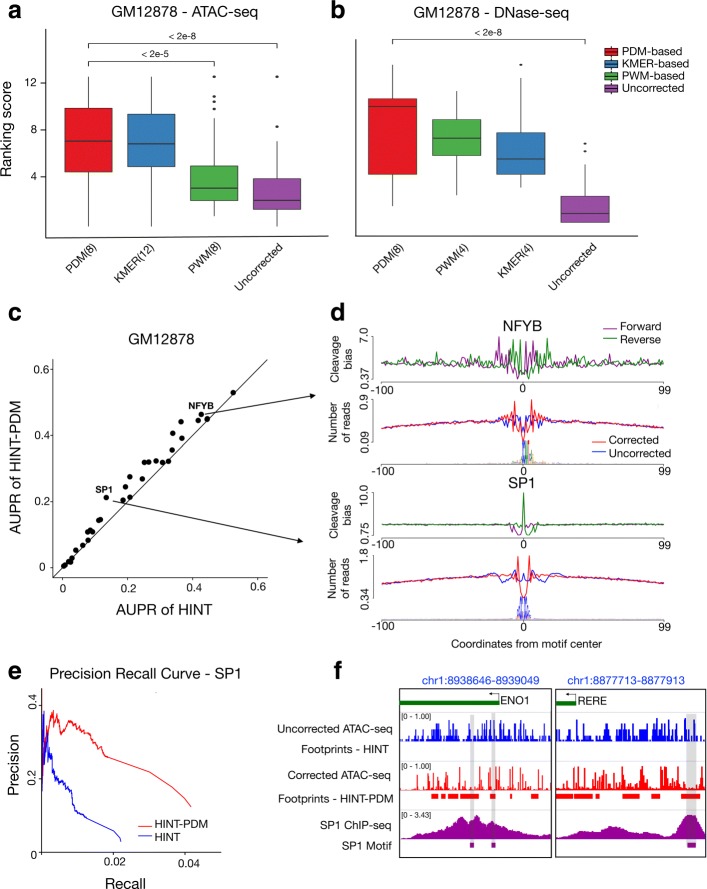
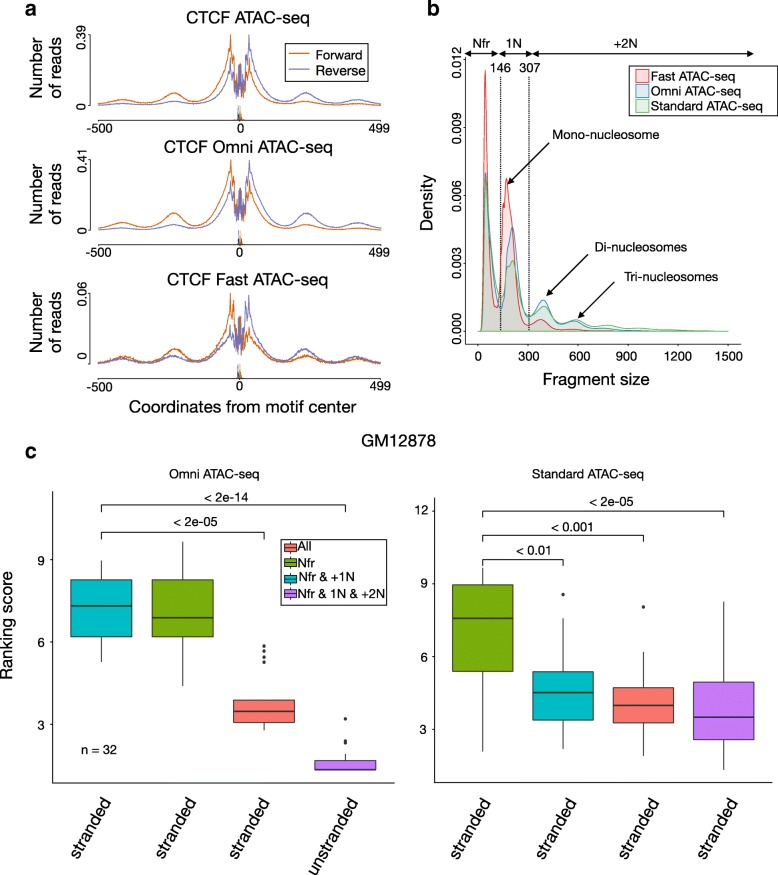
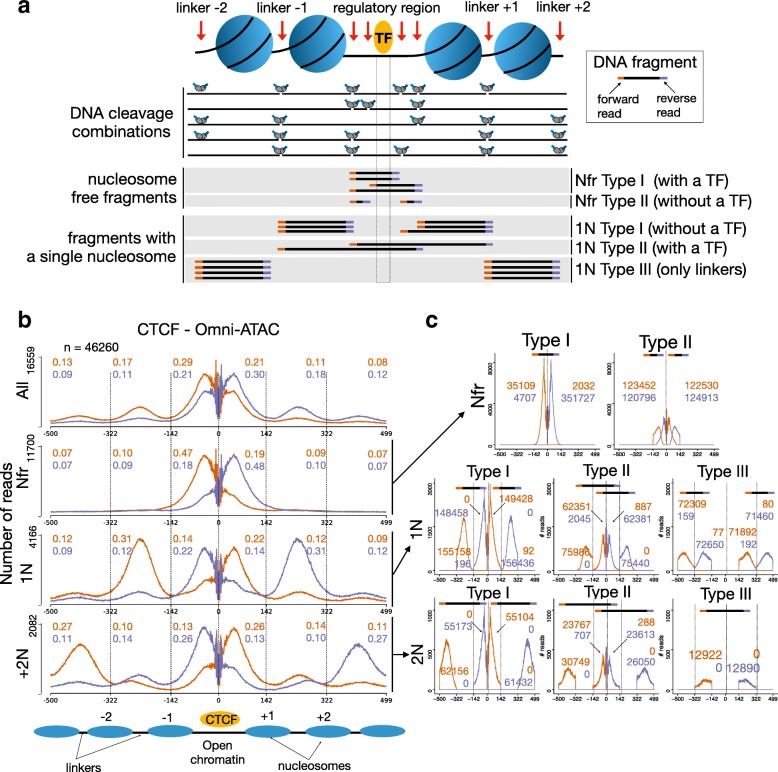
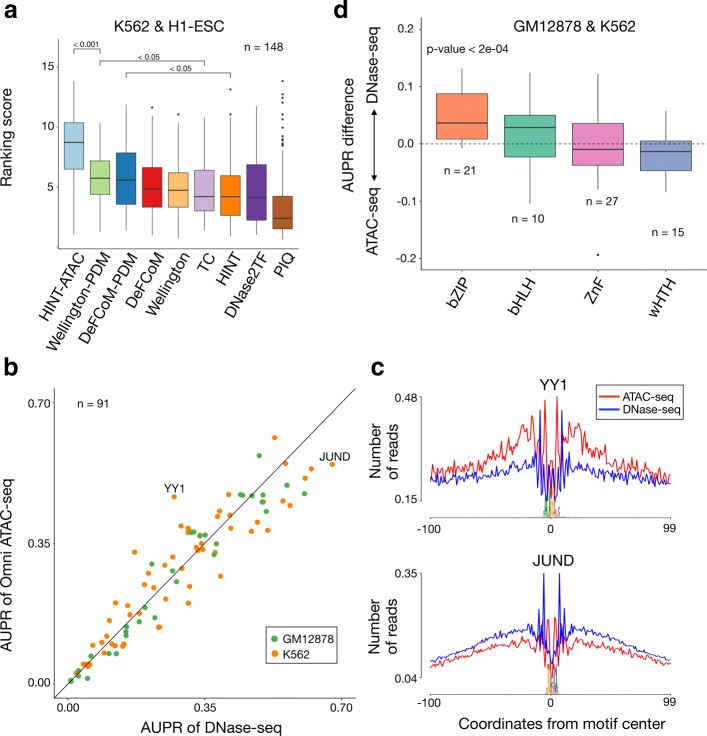
Transposase-Accessible Chromatin followed by sequencing (ATAC-seq) is a simple protocol for detection of open chromatin. Computational footprinting, the search for regions with depletion of cleavage events due to transcription factor binding, is poorly understood for ATAC-seq. We propose the first footprinting method considering ATAC-seq protocol artifacts. HINT-ATAC uses a position dependency model to learn the cleavage preferences of the transposase. We observe strand-specific cleavage patterns around transcription factor binding sites, which are determined by local nucleosome architecture. By incorporating all these biases, HINT-ATAC is able to significantly outperform competing methods in the prediction of transcription factor binding sites with footprints.

Keywords: ATAC-seq; Cleavage bias; Computational footprinting; Open chromatin.


Conflict of interest statement

Ethics approval and consent to participate

Not applicable.

Consent for publication

Not applicable.

Competing interests

The authors declare that they have no competing interests.

Publisher’s Note

Springer Nature remains neutral with regard to jurisdictional claims in published maps and institutional affiliations.

Figures

Fig. 1
Fig. 1
Cleavage enzymes of ATAC-seq and DNase-seq. Sequence motif relative to aligned read starts after cleavage with Tn5 and DNase I enzymes on naked DNA ATAC-seq (a) and DNase-seq (b) experiments. Position 1 corresponds to the start position of the ATAC/DNase-seq read. The size of the motifs is reflected by the structural protein contacts of Tn5 and DNase-I (Protein Data Bank entries 1MM8 and 2DNJ). c Tn5 inserts adapters in both DNA ends. Moreover, DNA is cleaved into two 9 bps single ends, which are later repaired in the ATAC-seq protocol
Fig. 2
Fig. 2
Strategies for cleavage bias correction. Comparison of bias estimation methods in standard ATAC-seq (a) and DNase-seq (b) on 32 TF ChIP-seq data sets from GM12878 cells. The y-axis denotes the ranking score, where higher values indicate higher recovery of footprints supported by TF ChIP-seq peaks. Numbers after methods names (x-axis) indicate optimal word size (k). p values are based on the Friedman-Nemenyi test (see Additional file 1: Table S1–S12 for complete results). c The scatter plot contrasting AUPR of HINT with PDM-based estimation with 8-mers (y-axis) and HINT without bias correction (x-axis) in GM12878 cells. d Bias estimates and average ATAC-seq signals centered around NFYB and SP1 motifs supported by a ChIP-seq peaks in GM12878 cells. e Precision-recall curve also supports the improvement in prediction of SP1 ChIP-Seq supported binding sites with cleavage bias correction. f ATAC-seq cleavage signals and footprint predictions with (HINT-PDM) and without (HINT) bias correction in two selected genomic regions. Footprint predictions on bias-corrected signals match SP1 motifs supported by ChIP-seq peaks, while no footprints are predicted in uncorrected ATAC-seq due to the presence of cleavage sites within the SP1 motif
Fig. 3
Fig. 3
Local nucleosome architecture and footprints. a Cleavage profiles around CTCF ChIP-seq peaks indicate strand-specific cleavage preference left/right of the TF binding site for distinct ATAC-seq protocols in GM12878 cells. Smaller peaks away from the center represent linker regions between histones. b Fragment size distribution for ATAC-seq protocols on GM12878 cells indicates clear peaks representing fragments with particular numbers of nucleosomes. Local minimum values were used to define nucleosome-free fragments Nfr, fragments with one nucleosome 1N and fragments with one or more +2N nucleosomes. c Comparison of HINT-ATAC models with distinct nucleosome decomposition strategies of Omni ATAC-seq (left) and standard ATAC-seq (right) on GM12787 cells. A higher ranking score (y-axis) indicates highest recovery of ChIP-seq supported binding sites. Labels in the x-axis indicate if strand information is used by the model. p values are based on the Friedman-Nemenyi test
Fig. 4
Fig. 4
Nucleosome architecture and strand-specific cleavage profiles. a Tn5 digests open chromatin regions left/right of the TF binding (regulatory region) or in nucleosome linkers. Nucleosome-free fragments will generate reads with (Nfr type I) or without (Nrf type II) the TF bound to DNA. As sequencing is performed from the 5 to 3 ends, Nfr type I fragments will always generate forward reads on the left (orange) and reverse reads on the right (blue) relatively to the TF binding site. DNA fragments from 1N decomposition with a cleavage event in the regulatory region will either include (1N Type II) or not (1N Type I) a TF. 1N Type III are produced by cleavage events between two neighboring linkers. b Bias-corrected average cleavage profile around CTCF ChIP-seq peaks for Omni-ATAC in GM12878 cells for fragments with distinct number of nucleosomes. Strand bias can be estimated as the ratio of reads in forward (orange) and reverse (blue) around intervals between nucleosomes and CTCF. c Decomposition of Nfr, 1N and 2N fragments by types clarifies the origin of strand cleavage bias. Numbers in orange (blue) indicate amount of reads in the forward (reverse) strand at each interval
Fig. 5
Fig. 5
Competing methods and protocols comparison. a Comparative evaluation of HINT-ATAC, HINT, Wellington, DNase2TF, DeFCoM, and PIQ on the test dataset (H1-ESC and K562 cells). A higher ranking score indicates highest recovery of ChIP-seq supported binding sites. p values are based on the Friedman-Nemenyi test. We only show the significant p values of the top 3 methods (see Additional file 1: Table S23–S24 for complete results). b AUPR values of DNase-seq (DH) vs ATAC-seq (Omni) for 91 factors, of which 41 factors obtain higher AUPR using ATAC-seq. c The footprint profiles of two factors with the highest AUPR difference are shown. d Difference in AUPR of double-hit DNase-seq and Omni ATAC-seq by grouping TFs by transcription factor families as defined in JASPAR database. Only families with more than 10 TFs are shown, and p values are obtained with a t test (mean = 0)
Fig. 6
Fig. 6
Application to ATAC-seq data of dendritic cell (DC) differentiation. a A two-step culture system differentiates ex vivo multipotent progenitors (MPP) to DC progenitors (CDP) and further to classical DC type1 and type2 (cDC1 and cDC2, respectively) or plasmacytoid DC (pDC). b Cell-specific activity of 579 TFs with motifs in either ATAC-seq peaks or footprints by Wellington or HINT-ATAC. Y-axis indicates the difference in activity in cDC1 compared to pDC cells (pDC-cDC1). Names of TFs with significant differential activity values are shown (adjusted p value <0.05; t test) and represent TFs above/below dotted lines. TFs with at least 0.5 log fold change (FC) in gene expression are highlighted (larger fonts), and known DC relevant TFs are marked in green. c Area under the precision recall curve evaluated with Batf3 ChIP-seq in cDC1. d Average cleavage profiles of Tcf4 and Batf3 motifs supported by ATAC-seq peaks, Wellington or HINT-ATAC footprints. e Regions with ATAC-seq and Batf3 ChIP-seq peaks in cDC cells close to DC relevant genes. We display all footprints from Wellington, HINT-ATAC, and all motifs found inside ATAC-seq peaks. While both Wellington and HINT-ATAC find footprints supporting motifs matching summits of Batf3 ChIP-seq peaks (sites 3 and 5 in green), Wellington footprints also support binding sites (2 and 4 in pink), which are not supported by the ChIP-seq signal

References

    1. Boyle AP, Davis S, Shulha HP, Meltzer P, Margulies EH, Weng Z, Furey TS, Crawford GE. High-resolution mapping and characterization of open chromatin across the genome. Cell. 2008;132(2):311–22. doi: 10.1016/j.cell.2007.12.014. - DOI - PMC - PubMed
    1. Crawford GE, Holt IE, Whittle J, Webb BD, Tai D, Davis S, Margulies EH, Chen Y, Bernat JA, Ginsburg D, et al.Genome Res. 2006; 16(1):123–31. - PMC - PubMed
    1. Neph S, Stergachis AB, Reynolds A, Sandstrom R, Borenstein E, Stamatoyannopoulos JA. Cell. 2012; 150(6):1274–86. - PMC - PubMed
    1. Vierstra J, Stamatoyannopoulos JA. Nat Methods. 2016; 13(3):213–21. - PubMed
    1. Buenrostro JD, Giresi PG, Zaba LC, Chang HY, Greenleaf WJ. Nat Methods. 2013; 10(12):1213–8. - PMC - PubMed

Publication types