An analytic approach to identifying the sources of the low-frequency round window cochlear response
- PMID: 30808536
- PMCID: PMC6416063
- DOI: 10.1016/j.heares.2019.02.001
An analytic approach to identifying the sources of the low-frequency round window cochlear response
Abstract
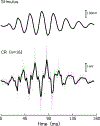
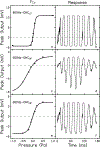
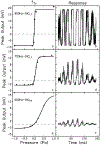
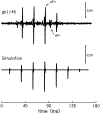
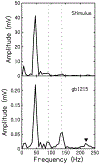
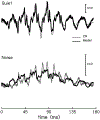
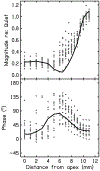
The cochlear microphonic, traditionally thought of as an indication of electrical current flow through hair cells, in conjunction with suppressing high-pass noise or tones, is a promising method of assessing the health of outer hair cells at specific locations along the cochlear partition. We propose that the electrical potential recorded from the round window in gerbils in response to low-frequency tones, which we call cochlear response (CR), contains significant responses from multiple cellular sources, which may expand its diagnostic purview. In this study, CR is measured in the gerbil and modeled to identify its contributing sources. CR was recorded via an electrode placed in the round window niche of sixteen Mongolian gerbils and elicited with a 45 Hz tone burst embedded in 18 high-pass filtered noise conditions to target responses from increasing regions along the cochlear partition. Possible sources were modeled using previously-published hair cell and auditory nerve response data, and then weighted and combined using linear regression to produce a model response that fits closely to the mean CR waveform. The significant contributing sources identified by the model are outer hair cells, inner hair cells, and the auditory nerve. We conclude that the low-frequency CR contains contributions from several cellular sources.
Copyright © 2019 Elsevier B.V. All rights reserved.
Figures


Similar articles
-
The potential use of low-frequency tones to locate regions of outer hair cell loss.Hear Res. 2016 Dec;342:39-47. doi: 10.1016/j.heares.2016.09.006. Epub 2016 Sep 24. Hear Res. 2016. PMID: 27677389 Free PMC article.
-
Hair cell and neural contributions to the cochlear summating potential.J Neurophysiol. 2019 Jun 1;121(6):2163-2180. doi: 10.1152/jn.00006.2019. Epub 2019 Apr 3. J Neurophysiol. 2019. PMID: 30943095 Free PMC article.
-
Predicting the location of missing outer hair cells using the electrical signal recorded at the round window.J Acoust Soc Am. 2014 Sep;136(3):1212. doi: 10.1121/1.4890641. J Acoust Soc Am. 2014. PMID: 25190395 Free PMC article.
-
[Conversion of sound into auditory nerve action potentials].HNO. 2016 Nov;64(11):808-814. doi: 10.1007/s00106-016-0258-z. HNO. 2016. PMID: 27785535 Review. German.
-
Editorial: 'auditory neuropathy' and cochlear implantation - myths and facts.Cochlear Implants Int. 2008 Mar;9(1):1-7. doi: 10.1179/cim.2008.9.1.1. Cochlear Implants Int. 2008. PMID: 18246533 Review.
Cited by
-
Middle ear muscle and medial olivocochlear activity inferred from individual human ears via cochlear potentials.J Acoust Soc Am. 2023 Mar;153(3):1723. doi: 10.1121/10.0017604. J Acoust Soc Am. 2023. PMID: 37002081 Free PMC article.
-
High-Resolution EEG Amplifiers Are Feasible for Electrocochleography Without Time Restriction.Audiol Res. 2025 Jan 21;15(1):8. doi: 10.3390/audiolres15010008. Audiol Res. 2025. PMID: 39997152 Free PMC article.
References
-
- Boettcher FA, Mills JH, Dubno JR, & Schmiedt RA (1995). Masking of auditory brainstem responses in young and aged gerbils. Hearing Research, 89(1–2), 1–13. Retrieved from http://www.ncbi.nlm.nih.gov/pubmed/8600113 - PubMed
Publication types
MeSH terms
Grants and funding
LinkOut - more resources
Full Text Sources
Miscellaneous

