. 2019 May;78(5):600-609.
doi: 10.1136/annrheumdis-2018-213799. Epub 2019 Feb 26.

PTPN14 phosphatase and YAP promote TGFβ signalling in rheumatoid synoviocytes

Affiliations

PTPN14 phosphatase and YAP promote TGFβ signalling in rheumatoid synoviocytes

Angel Bottini et al. Ann Rheum Dis. 2019 May.

Abstract

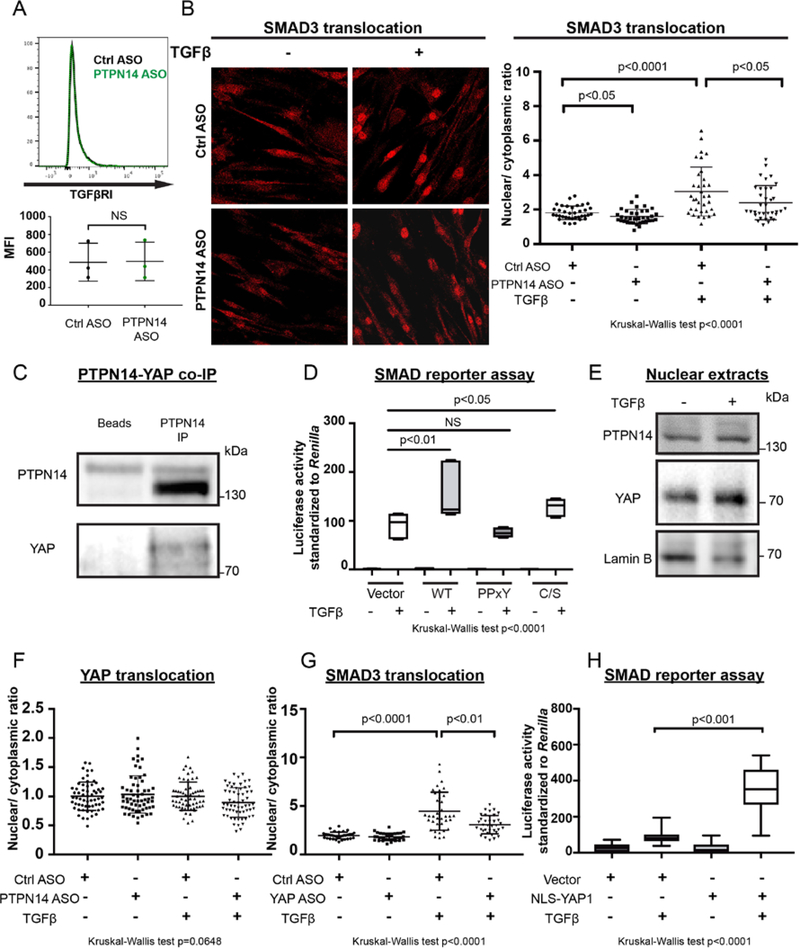
Objective: We aimed to understand the role of the tyrosine phosphatase PTPN14-which in cancer cells modulates the Hippo pathway by retaining YAP in the cytosol-in fibroblast-like synoviocytes (FLS) from patients with rheumatoid arthritis (RA).

Methods: Gene/protein expression levels were measured by quantitative PCR and/or Western blotting. Gene knockdown in RA FLS was achieved using antisense oligonucleotides. The interaction between PTPN14 and YAP was assessed by immunoprecipitation. The cellular localisation of YAP and SMAD3 was examined via immunofluorescence. SMAD reporter studies were carried out in HEK293T cells. The RA FLS/cartilage coimplantation and passive K/BxN models were used to examine the role of YAP in arthritis.

Results: RA FLS displayed overexpression of PTPN14 when compared with FLS from patients with osteoarthritis (OA). PTPN14 knockdown in RA FLS impaired TGFβ-dependent expression of MMP13 and potentiation of TNF signalling. In RA FLS, PTPN14 formed a complex with YAP. Expression of PTPN14 or nuclear YAP-but not of a non-YAP-interacting PTPN14 mutant-enhanced SMAD reporter activity. YAP promoted TGFβ-dependent SMAD3 nuclear localisation in RA FLS. Differences in epigenetic marks within Hippo pathway genes, including YAP, were found between RA FLS and OA FLS. Inhibition of YAP reduced RA FLS pathogenic behaviour and ameliorated arthritis severity.

Conclusion: In RA FLS, PTPN14 and YAP promote nuclear localisation of SMAD3. YAP enhances a range of RA FLS pathogenic behaviours which, together with epigenetic evidence, points to the Hippo pathway as an important regulator of RA FLS behaviour.

Keywords: K/BxN; PTPN14; TGFβ; Verteporfin; YAP; fibroblast-like synoviocytes; rheumatoid arthritis.


Conflict of interest statement

Competing interests: None declared.

Figures

Figure 1.
Figure 1.. PTPN14 displays TGFβ-dependent overexpression in RA FLS.
A. PTPN14 mRNA expression was assessed by qPCR in 11 RA FLS lines and 10 OA FLS lines. Results were normalized to POL2A using 2−ΔCt method. Mean±SEM are shown. B. PTPN14 protein expression levels in 3 RA FLS and 3 OA FLS lines was assessed by Western blotting. C. PTPN14 protein expression was assessed by western blot in 5 RA FLS lines and 5 OA FLS lines. Results were normalized to GAPDH. Mean±SEM are shown. D. IF of synovial sections from OA or RA patients stained with anti-PTPN14 antibody (green signal) and DAPI (blue signal). Representative images are shown at 60X magnification. E. PTPN14 mRNA expression levels measured by RNAseq in 65 non-fibroid vs 17 fibroid RA synovium specimens. F. RA FLS (n=5) were stimulated with platelet-derived growth factor (PDGF, 50 ng/ml) or transforming growth factor β1 (TGFβ, 50 ng/ml) for 24 hours. PTPN14 expression was assessed by qPCR. Results were normalized to GAPDH using 2−ΔΔCt method. Mean±SEM are shown. G. The expression level of PTPN14, TGFBR1 and THBS1 was assessed by qPCR on 11 RA FLS lines and 11 OA FLS lines. Graphs show PTPN14 vs TGFBR1 expression or PTPN14 vs THBS1 expression for each line. H-I. PTPN14 mRNA expression was measured by qPCR performed in triplicate after RA FLS (n=4–5) treatment with 50 μM TGFβRI inhibitor SB505124 (H) or 1 μM RepSox (I) for 24 hours. Results were normalized to GAPDH using 2−ΔΔCt method. Box-and-whisker plots (E,H,I) depict median (line within box), 25th percentile and 75th percentile (bottom and top borders), and range of minimum to maximum values (whiskers). Data were analyzed using the two-tailed Mann-Whitney test (A,C,E,H,I), the Kruskal-Wallis test with two-tailed Mann-Whitney post-hoc test (F) or the Spearman correlation test (G). p-value was adjusted for multiple comparison in (F). LFS, fibroblast-like synoviocytes; IF, immunofluorescence; OA, osteoarthritis; qPCR, quantitative PCR; RA, rheumatoid arthritis.
Figure 2.
Figure 2.. PTPN14 promotes TGFβ-dependent MMP production by RA FLS.
A. RA FLS (n=4) were treated with Ctrl ASO or PTPN14 ASO for 6 days, serum-starved in the presence of ASO for 24 hours and then stimulated with or without TNFα for 24 hours. MMP1, and MMP13 mRNA expression was measured by qPCR performed in triplicate. Results were normalized to GAPDH using 2−ΔΔCt method. B. RA FLS (n=4) were treated with Ctrl ASO or PTPN14 ASO for 6 days and serum starved for 24 hours in the presence of ASO. For migration assay, treated cells were allowed to migrate for 24 hours in transwell assay in response to 5% FBS. For invasion assay, treated cells were allowed to invade through matrix-coated transwells for 24 hours in response to 5% FBS. Cells were then fixed with 100% methanol and stained with 0.2% crystal violet. For each well, four non-overlapping area (top, bottom, left and right) were imaged and counted. For cartilage attachment assay, bovine cartilage fragments were pre-treated with IL-1β (2 ng/ml) for 24 hours. Cells were incubated in constant rotation with cartilage fragments for 2 hours and then incubated at 37°C overnight. C. After serum starvation for 24 hours, RA FLS (n=4) were incubated in the presence or absence of 25 μM SB505124 (SB) and stimulated with or without TNFα for 24 hours. MMP1 and MMP13 mRNA expression was analyzed by qPCR performed in triplicate. Results were normalized to GAPDH using 2−ΔΔCt method. D. RA FLS (n=5 or 6) were treated with Ctrl or PTPN14 ASO for 6 days, serum starved with the presence of ASO for 24 hours and then stimulated with TGFβ for 24 hours. MMP13 mRNA expression were analyzed by qPCR performed in triplicate. Results were normalized to GAPDH using 2−ΔΔCt method. (A-D) Box-and-whisker plots depict median (line within box), 25th percentile and 75th percentile (bottom and top borders), and range of minimum to maximum values (whiskers). Data were analyzed using the Kruskal-Wallis test with two-tailed Mann-Whitney post-hoc test (A-D) or the two-tailed Mann-Whitney test (right panels in A-C), NS = non-significant. ASO, antisense oligonucleotides; FBS, fetal bovine serum; FLS, fibroblast-like synoviocytes; qPCR, quantitative PCR; RA, rheumatoid arthritis
Figure 3.
Figure 3.. PTPN14-YAP interaction and nuclear YAP enhance TGFβ-SMAD signaling.
A. Upper panel, representative flow cytometry analysis of TGFβRI on RA FLS (n=3) treated with Ctrl (shown in black) or PTPN14 ASO (shown in green) for 6 days. Lower panel, plot shows MFI for each line. B. RA FLS (n=3) were treated with Ctrl or PTPN14 ASO for 7 days, stimulated with TGFβ (50 ng/ml) for 30 min, then fixed and stained with an anti-SMAD3 antibody. Nuclear/cytoplasmic ratio of SMAD3 signal was calculated using image J for 12 cells from each RA FLS line. Representative images are shown in 60X magnification. Mean±SD is shown. C. Co-immunoprecipitation of PTPN14 with YAP. Western blotting with indicated antibodies is shown. Panel is representative of 3 experiments with similar results. D. TGFβ-induced SMAD activation was assessed via SMAD reporter assay in HEK293T cells. Cells were starved for 24 hours, transfected with empty vector, or vectors encoding WT PTPN14, or PTPN14 Y570F/Y732F (PPxY) or C1121S (C/S) mutants and then stimulated with TGFβ (50 ng/ml) for 24 hours. Graph shows ratio of firefly/Renilla luciferase signal. E. Western blotting of nuclear fraction of unstimulated or TGFβ-stimulated RA FLS using anti-PTPN14, anti-YAP or anti-lamin B (as a nuclear loading control). Panel is representative of 3 RA FLS lines with similar results. F. RA FLS (n=5) were treated with Ctrl or PTPN14 ASO for 7 days stimulated with TGFβ (50 ng/ml) for 30 min, then fixed and stained with an anti-YAP antibody. Nuclear/cytoplasmic ratio of YAP signal was calculated using image J for 12 cells from each RA FLS line. Representative images are shown in 60X magnification. Mean±SD is shown. G. RA FLS were treated with Ctrl or PTPN14 ASO for 7 days stimulated with TGFβ (50 ng/ml) for 30 min, then fixed and stained with an anti-SMAD3 antibody. Nuclear/cytoplasmic ratio of SMAD3 signal was calculated using image J for 12 cells from each RA FLS line. Representative images are shown in 60X magnification. Mean±SD is shown. H. TGFβ-induced SMAD activation was assessed via SMAD reporter assay in HEK293T cells. Cells were starved for 24 hours, transfected with empty vector, or vectors encoding NLS-YAP and then stimulated with TGFβ (50 ng/ml) for 24 hours. Graph shows ratio of firefly/renilla luciferase signal. (D,H) Box-and-whisker plots depict median (line within box), 25th percentile and 75th percentile (bottom and top borders), and range of minimum to maximum values (whiskers), 3 independent experiments performed in triplicate is shown. (A) Data were analyzed using the two-tailed paired t-test. (B,D,F-H) Data were analyzed using the Kruskal-Wallis test with two-tailed Mann-Whitney post-hoc test, NS = non-significant. p-value is adjusted for multiple comparison in (D). FLIS, fibroblast-like synoviocytes; MFI, mean fluorescence intensity; RA, rheumatoid arthritis.
Figure 4.
Figure 4.. The Hippo pathway displays epigenetic alterations in RA FLS and modulates RA FLS TNF signaling and invasiveness.
A. The ingenuity pathway of Hippo signaling. Differentially marked genes (DMG) between RA and OA FLS are indicated in magenta color. Legends: triangles for kinases; rectangles for G-protein coupled receptors; circles for transcription regulator; oval for other; double-sided shapes for complexes/groups. B. Map of differentially modified marks for DMG in the Hippo signaling pathway between RA and OA FLS. C. Representative epigenomic landscape of YAP1 including six histone modifications, open chromatin, RNA-seq and DNA methylation. The figure shows an example of relative signal intensity across a ± 300 kb region of YAP1 for each mark in one RA vs one OA FLS lines. Differentially marked regions between RA and OA are indicated by boxes. D. RA FLS (n=4) were serum-starved for 24 hours, and then treated with DMSO or 1μM verteporfin (VP) for 45 min. Cells were then stimulated for 24 hours with 50 ng/ml TNF in the presence of DMSO or VP. MMP1, and MMP13 mRNA expression levels were determined by qPCR performed in triplicate. Results were normalized to GAPDH using 2−ΔΔCt method. Box-and-whisker plots depict median (line within box), 25th percentile and 75th percentile (bottom and top borders), and range of minimum to maximum values (whiskers). E. After 24h serum starvation, RA FLS (n=5) were allowed to invade for 24h through a matrigel-coated transwell chamber in response to 5% FBS in the presence of DMSO or 1μM VP. For each well, four non-overlapping area (top, bottom, left and right) were imaged and counted. Plot shows mean±SD percent invading cells. Data were analyzed using the Kruskal-Wallis test with two-tailed Mann-Whitney post-hoc test (D,E) or the two-tailed Mann-Whitney test (right panel in D). DMG, differentially marked genes; DMSO, dimethyl sulfoxide; FLS, fibroblast-like synoviocytes; OA, osteoarthritis; qPCR, quantitative PCR; RA, rheumatoid arthritis; VP, verteporfin.
Figure 5.
Figure 5.. YAP promotes RA FLS invasiveness and arthritis severity in mice.
A. Cartilage fragments were co-implanted with 5 X 10⁵ RA FLS (n=2) subcutaneously in SCID mice. Mice (n=3–4) were injected intraperitoneally (i.p.) with 15 mg/kg VP or vehicle every other day for 34 days. Two days after the last administration, the cartilage was harvested and assessed for FLS invasion. Representative images of cartilage sections viewed at 20X magnification are shown. S = sponge, C = cartilage. Plot shows mean±SD of the depth of cartilage invasion by RA FLS assessed on a minimum of 4 fields/specimen. B. Eight-week-old female Balb/c mice were injected i.p. with 100μL of K/BxN serum to induce arthritis, and injected i.p. daily with 50 mg/kg verteporfin (n=28) or DMSO-containing vehicle (n=25) starting on the day of arthritis induction. Ankle thickness and clinical score were assessed every day. Graph shows mean±SEM of mouse ankle swelling (left graph) and clinical score (right graph). C. After 14 days, joints from mice in B were harvested and subjected to histological staining with H&E (for inflammation and bone erosion assessment) and safranin O (for cartilage damage assessment). Inflammation, bone erosion and cartilage damage of the talonavicular joint were scored blindly between 0 and 5 by two people. Plot shows mean±SEM of combined scores. Data were analyzed with two-tailed Mann-Whitney test (A,C) or two-tailed Mann-Whitney test using area under curve in (B). DMSO, dimethyl sulfoxide; FLS, fibroblast-like synoviocytes; RA, rheumatoid arthritis.

Similar articles

Cited by

References

    1. Bottini N, Firestein GS. Duality of fibroblast-like synoviocytes in RA: passive responders and imprinted aggressors. Nat Rev Rheumatol. 2013. January; 9(1):24–33. - PMC - PubMed
    1. Muller-Ladner U, Ospelt C, Gay S, Distler O, Pap T. Cells of the synovium in rheumatoid arthritis. Synovial fibroblasts. Arthritis Res Ther. 2007; 9(6):223. - PMC - PubMed
    1. Buckley CD. Why does chronic inflammation persist: An unexpected role for fibroblasts. Immunol Lett. 2011. July; 138(1):12–14. - PMC - PubMed
    1. Feldmann M, Maini RN. Perspectives From Masters in Rheumatology and Autoimmunity: Can We Get Closer to a Cure for Rheumatoid Arthritis? Arthritis Rheumatol. 2015. September; 67(9):2283–2291. - PubMed
    1. Doody KM, Stanford SM, Sacchetti C, Svensson MN, Coles CH, Mitakidis N, et al. Targeting phosphatase-dependent proteoglycan switch for rheumatoid arthritis therapy. Sci Transl Med. 2015. May 20; 7(288):288ra276. - PMC - PubMed

Publication types

MeSH terms

Substances