. 2019 Apr 19;294(16):6506-6521.
doi: 10.1074/jbc.RA119.007626. Epub 2019 Feb 26.

Voltage-dependent activation in EAG channels follows a ligand-receptor rather than a mechanical-lever mechanism

Affiliations

Voltage-dependent activation in EAG channels follows a ligand-receptor rather than a mechanical-lever mechanism

Olfat A Malak et al. J Biol Chem. .

Abstract

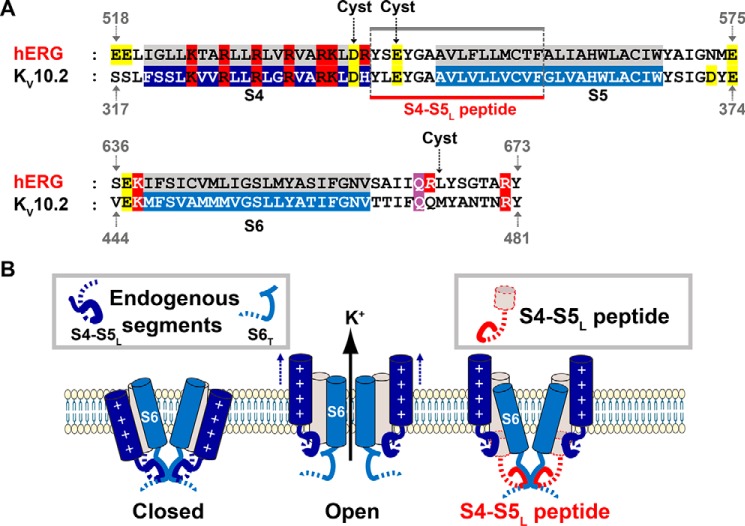
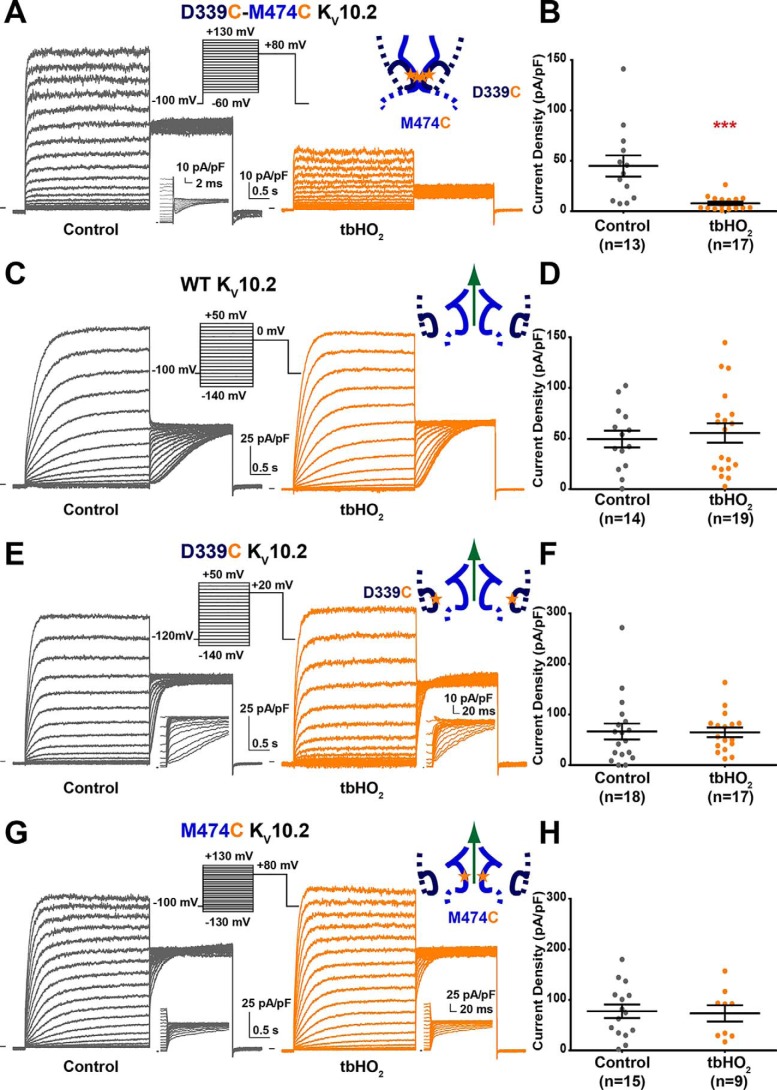
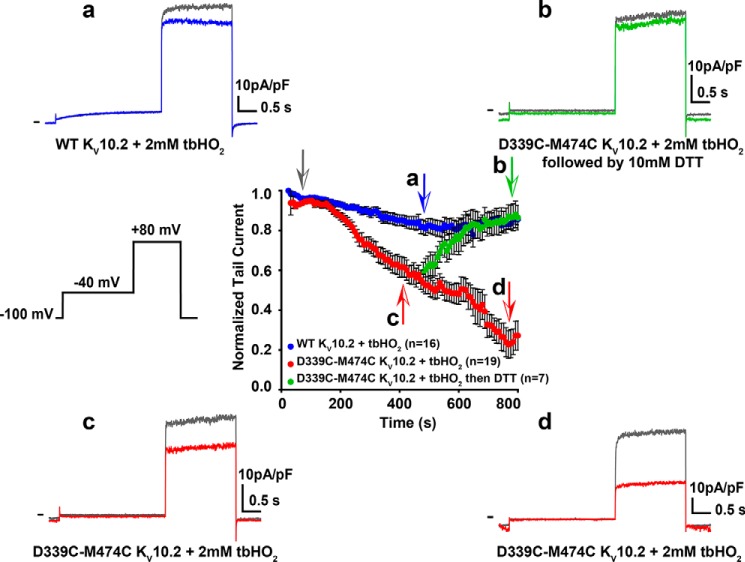
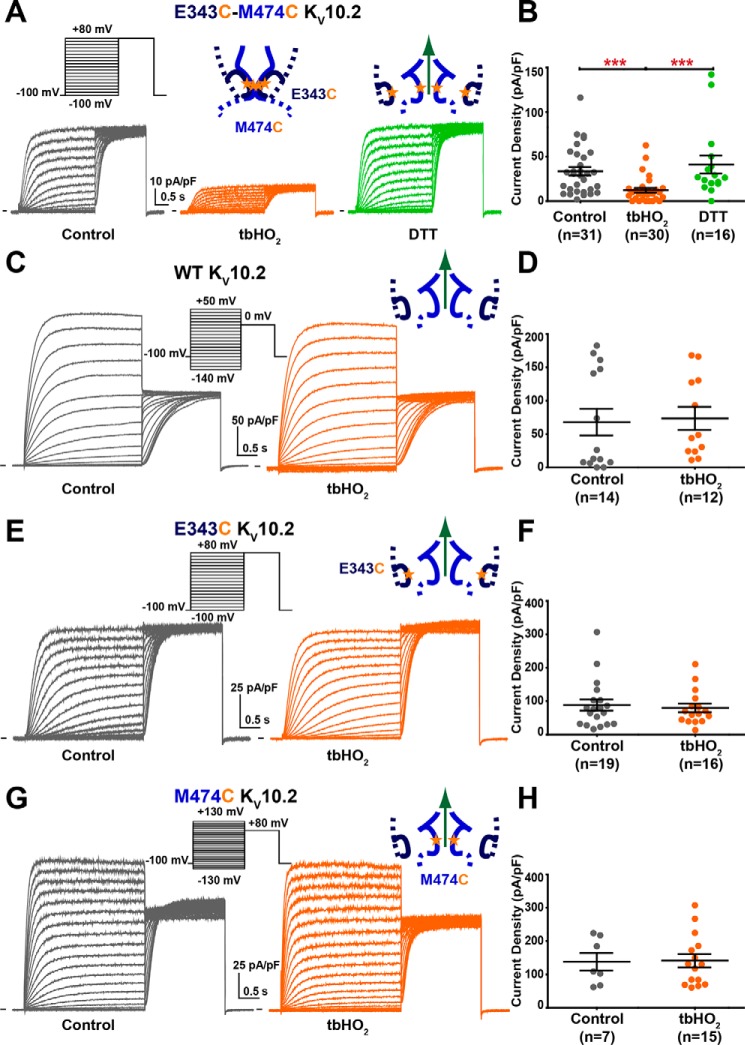
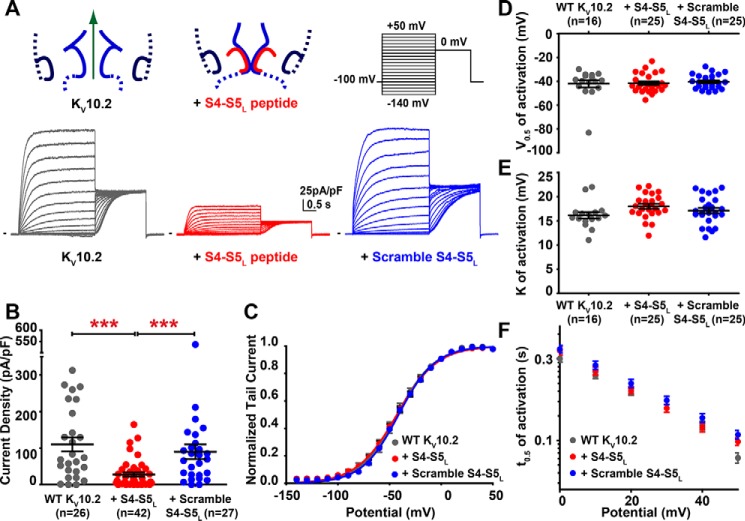
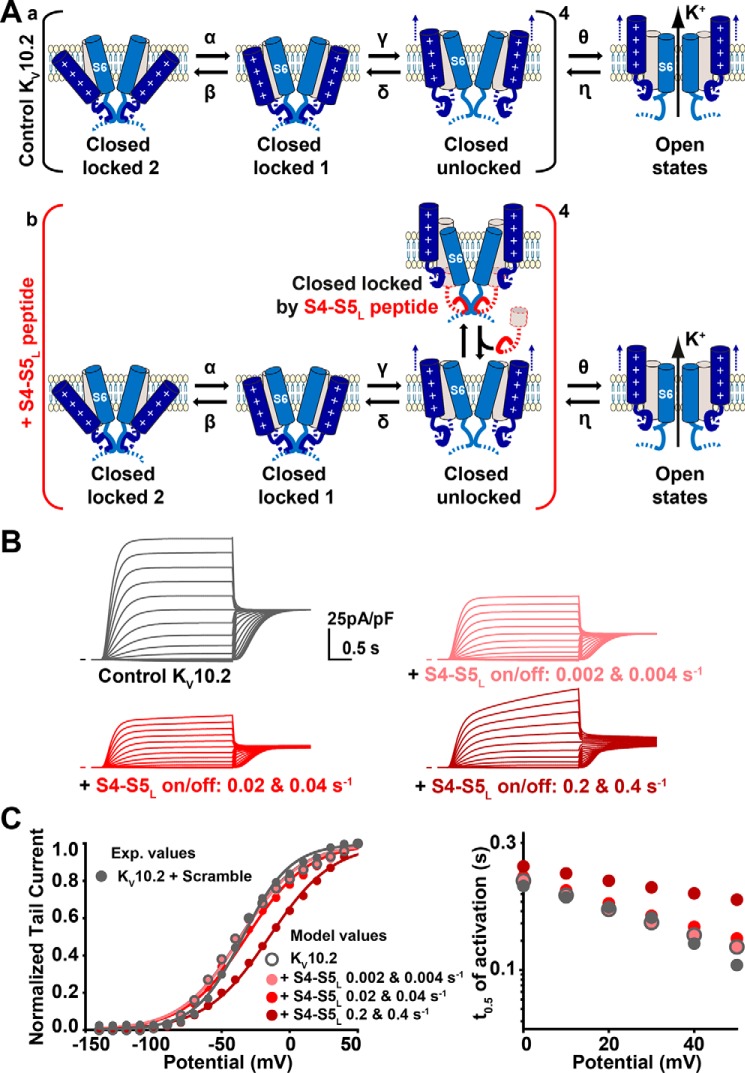
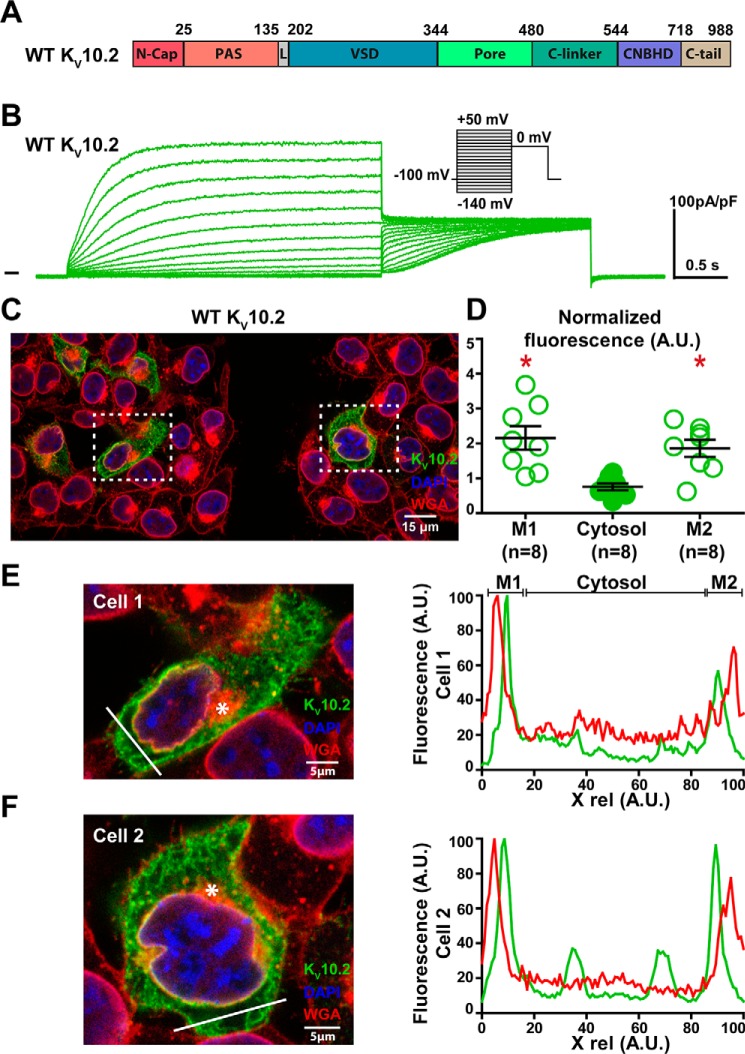
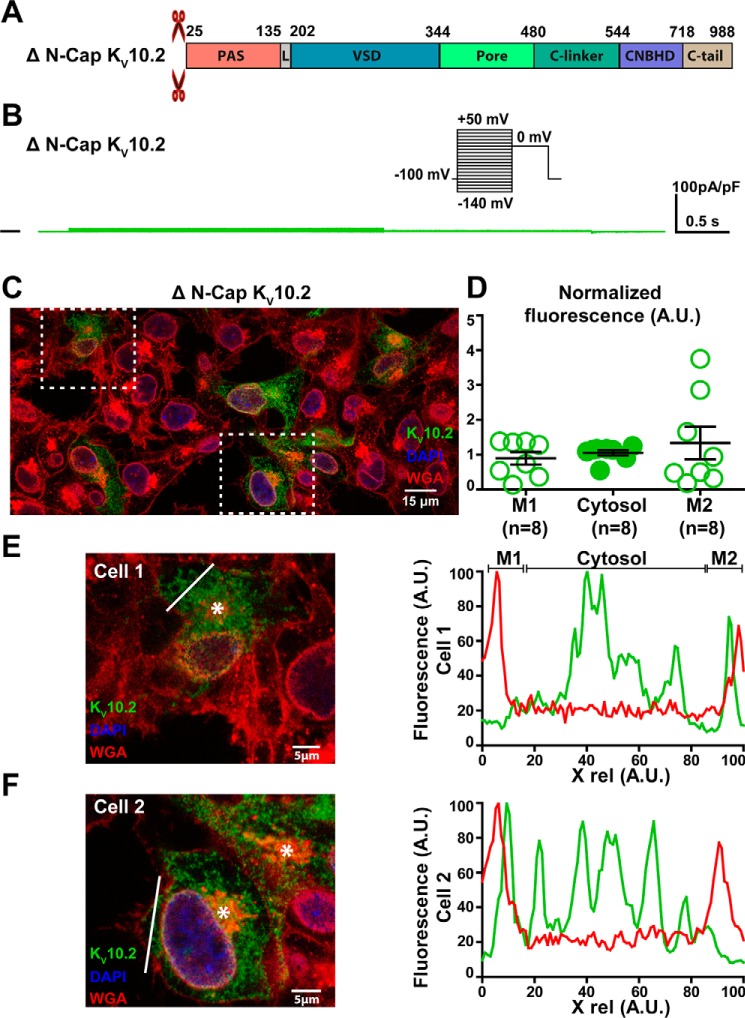
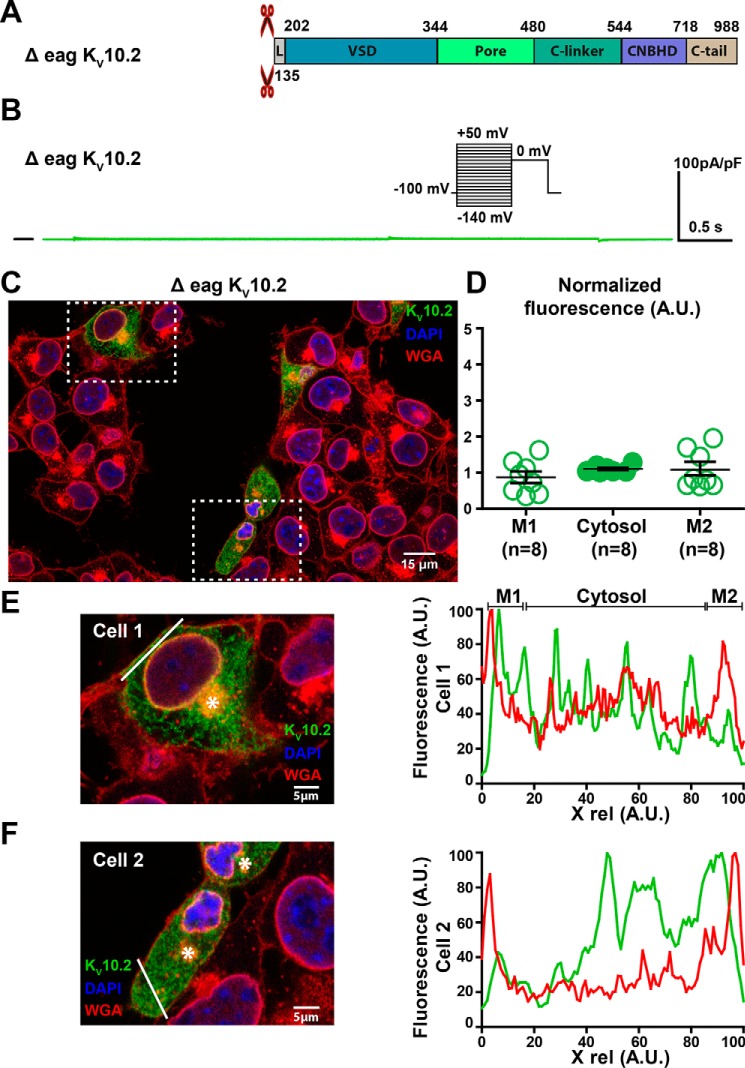
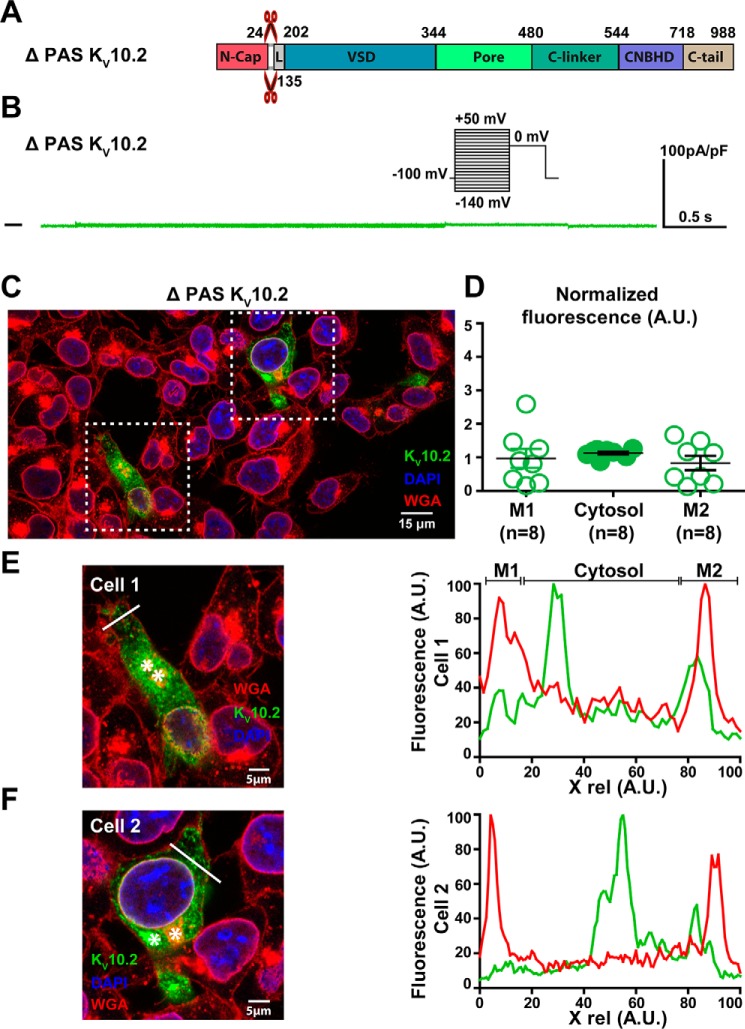
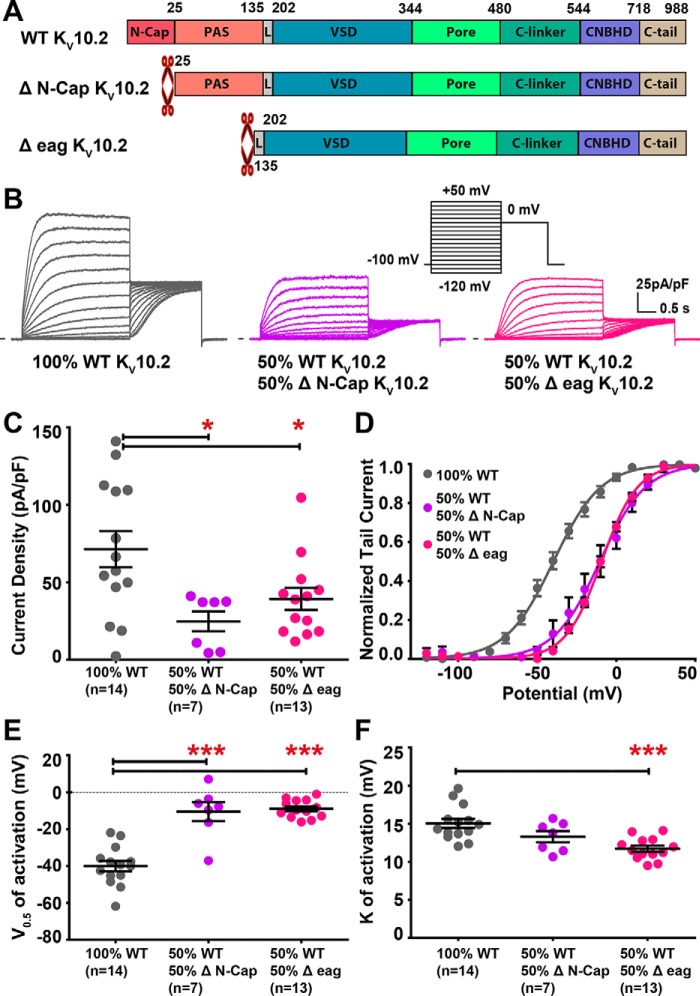
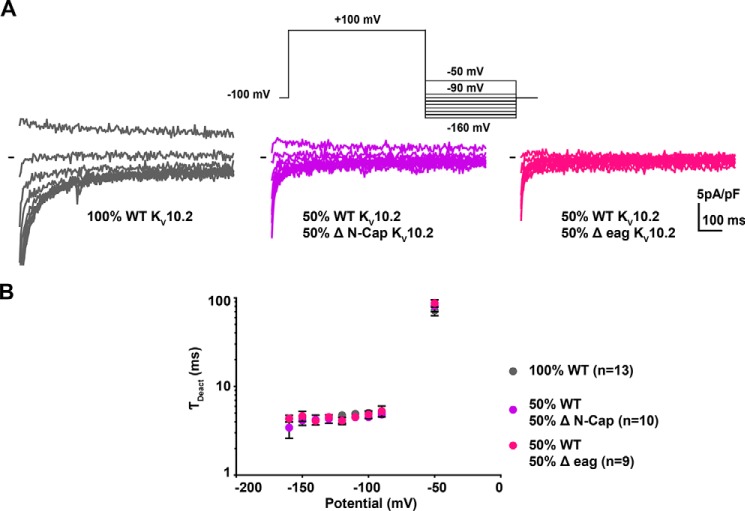
Ether-a-go-go family (EAG) channels play a major role in many physiological processes in humans, including cardiac repolarization and cell proliferation. Cryo-EM structures of two of them, KV10.1 and human ether-a-go-go-related gene (hERG or KV11.1), have revealed an original nondomain-swapped structure, suggesting that the mechanism of voltage-dependent gating of these two channels is quite different from the classical mechanical-lever model. Molecular aspects of hERG voltage-gating have been extensively studied, indicating that the S4-S5 linker (S4-S5L) acts as a ligand binding to the S6 gate (S6 C-terminal part, S6T) and stabilizes it in a closed state. Moreover, the N-terminal extremity of the channel, called N-Cap, has been suggested to interact with S4-S5L to modulate channel voltage-dependent gating, as N-Cap deletion drastically accelerates hERG channel deactivation. In this study, using COS-7 cells, site-directed mutagenesis, electrophysiological measurements, and immunofluorescence confocal microscopy, we addressed whether these two major mechanisms of voltage-dependent gating are conserved in KV10.2 channels. Using cysteine bridges and S4-S5L-mimicking peptides, we show that the ligand/receptor model is conserved in KV10.2, suggesting that this model is a hallmark of EAG channels. Truncation of the N-Cap domain, Per-Arnt-Sim (PAS) domain, or both in KV10.2 abolished the current and altered channel trafficking to the membrane, unlike for the hERG channel in which N-Cap and PAS domain truncations mainly affected channel deactivation. Our results suggest that EAG channels function via a conserved ligand/receptor model of voltage gating, but that the N-Cap and PAS domains have different roles in these channels.

Keywords: EAG channel; Kv 10.2 channel; S4-S5 linker; S6 C-terminus; allosteric regulation; biophysics; electrophysiology; ion channel; peptides; physiology; voltage dependence.


Conflict of interest statement

The authors declare that they have no conflicts of interest with the contents of this article

Figures

Figure 1.
Figure 1.
Alignment used to design the cysteine mutants and the S4-S5L peptide, hypothetical ligand/receptor model. A, alignment between hERG and KV10.2. This alignment was used to (i) introduce the cysteines in S4-S5L and S6T and (ii) design the S4-S5L peptide from the previously identified hERG S4-S5L inhibiting peptide. S4-S5L refers to the S4-S5 region, including the S4-S5 linker and a part of S5. S6T refers to the C-terminal part of the S6 segment, which is the activation gate. The alignment was obtained using Cobalt (43). In red are represented the basic residues, in yellow acidic residues, and in purple the position of the narrowest part of the bundle crossing, also the gating residue (44). The color boxes represent the transmembrane segments. Introduced cysteines in hERG (15) and KV10.2 in the present study are indicated. Gray line represents the inhibiting S4-S5L peptide in hERG (15). Red line represents the peptide engineered in KV10.2 for the present study. B, left: scheme of the hypothetical ligand/receptor model in which S4-S5L (deep blue) binds to S6T (light blue) to stabilize the channel in a closed state. Middle, upon membrane depolarization, S4 pulls S4-S5L out of the S6T receptor, allowing channel opening. Right, the KV10.2 S4-S5L peptide (red) mimics endogenous S4-S5L, locking the channel in its closed conformation.
Figure 2.
Figure 2.
Introduction of 2 cysteines in the S4-S5L and S6T regions of KV10.2 (D339C/M474C KV10.2) locks the channel closed in oxidative conditions. A, representative, superimposed recordings of the D339C/M474C KV10.2 current after 2 h incubation in Tyrode without (control) or with 0.2 mm tbHO2 (tbHO2). Left inset, activation voltage protocol used (one sweep every 8 s). Right inset, scheme of S4-S5L/S6T with introduced cysteines (stars). B, mean ± S.E. D339C/M474C KV10.2 maximum tail-current density, in control or tbHO2. ***, p < 0.001 versus control, Mann-Whitney test. C and D, same as A and B for WT KV10.2. E and F, same as A and B for D339C KV10.2. G and H, same as A and B for M474C KV10.2.
Figure 3.
Figure 3.
Kinetics of D339C/M474C KV10.2 current reduction upon addition of 2 mm tbHO2. Time course of the effect of tbHO2 application on normalized WT and D339C/M474C KV10.2 tail currents. From a holding potential of −100 mV, followed by a 3-s prepulse at −40 mV, tail currents were recorded at +80 mV, every 8 s. Following stabilization of the tail current, 2 mm tbHO2 was perfused (gray arrow), and the step protocol was repeated for 6 min. Following the tbHO2 application, a fraction of the cells was then perfused with 10 mm DTT, and the step protocol was continued for an additional 6 min. Each data point represents the mean ± S.E. current magnitude normalized to values obtained before tbHO2, n = 16 (WT), 19 (D339C/M474C in tbHO2), and 7 (D339C/M474C in DTT). Insets (a–d) correspond to representative recordings at the arrows.
Figure 4.
Figure 4.
Introduction of 2 cysteines in the S4-S5L and S6T regions of KV10.2 (E343C/M474C KV10.2) locks the channel closed in oxidative conditions. A, representative, superimposed recordings of the E343C/M474C KV10.2 current after 15 min incubation in Tyrode without (control) or with 2 mm tbHO2 (tbHO2), or after a subsequent 5-min incubation in 10 mm DTT. Left inset, activation voltage protocol used (one sweep every 8 s). Middle and right insets, schemes of S4-S5L/S6T with introduced cysteines in the presence of tbHO2 or DTT, respectively (stars). B, mean ± S.E. E343C/M474C KV10.2 maximum tail-current density, in control, tbHO2, or tbHO2 followed by DTT. ***, p < 0.001, Mann-Whitney test. C and D, same as A and B for WT KV10.2. E and F, same as A and B for E343C KV10.2. G and H, same as A and B for M474C KV10.2.
Figure 5.
Figure 5.
S4-S5L peptide inhibits KV10.2 channels. A, representative, superimposed recordings of the WT KV10.2 current in the absence (left; 2 μg of KV10.2 plus 2 μg of GFP encoding plasmids), in the presence of S4-S5L peptide (middle; 2 μg of KV10.2 plus 2 μg of peptide encoding plasmids), and in the presence of a scramble S4-S5L peptide (right; 2 μg of KV10.2 plus 2 μg of peptide encoding plasmids). Left insets: schemes of the hypothetical effect of the S4-S5L inhibiting peptide on KV10.2 channel; right inset: activation voltage protocol used (one sweep every 8 s). B, mean ± S.E. KV10.2 maximum tail-current density in the absence or presence of the indicated peptide (S4-S5L peptide or scramble S4-S5L peptide). ***, p < 0.001, Mann-Whitney test. C, activation curve, obtained from tail currents using the protocol shown in A, in the absence or presence of the indicated peptide (n = 16–25). D, mean ± S.E. half-activation potential in the absence or presence of the indicated peptide. E, mean ± S.E. activation curve slope in the absence or presence of the indicated peptide. F, mean ± S.E. half-activation time as a function of membrane potential, in the absence or presence of the indicated peptide.
Figure 6.
Figure 6.
Kinetic model of KV10.2 and its interaction with the S4-S5L peptide. A, kinetic model schemes. This model is based on a previous work on KCNE1-KCNQ1 (23). a, kinetic model in the absence of peptide, on which optimization has been performed (see “Experimental procedures”). Optimized transition rates are presented in Table 1. b, binding of exogenous S4-S5L locks the channel and prevents its opening. Peptides are supposed to interact with each monomer in the unlocked states. B, simulated currents during step protocols (same as in Fig. 5), in the absence (Ctrl) or presence of S4-S5L peptide, at the indicated S4-S5L on/off rates. C, gray filled circles: experimental activation curves and half-activation times in control condition. Other symbols: simulated values in the absence of peptide (control, open circles), or in the presence of peptides, at the indicated rates of peptide binding/unbinding.
Figure 7.
Figure 7.
WT KV10.2 characterization in transfected COS-7 cells. A, domain organization of the channel, showing the eag domain (N-Cap + PAS), a linker domain (L, also named proximal N terminus), the voltage-sensing domain (VSD), the pore domain, C-linker, CNBHD, and C-tail. B, representative, superimposed recordings of the WT KV10.2–1D4 current. Inset: voltage protocol used (one sweep every 8 s). C, representative confocal immunostainings of WT KV10.2–1D4 in transfected COS-7 cells (in green). WGA is used as a membrane marker (in red). Nuclei are stained with DAPI (in blue). Scale bar = 15 μm. D, mean ± S.E. fluorescence of KV10.2 signal in plasma membrane (M1 and M2) and cytosol, as measured in E and F, normalized by the average KV10.2 fluorescence. *, p < 0.05 versus cytosol, paired Student's t test. E and F, left: expanded view of two selected cells, showing the Golgi (stars) and the line used for the line plots shown at the right. Lines have been placed as far as possible from the Golgi to generate accurate plasma membrane plots. Right: line plots of WGA (red) and KV10.2 (green) at the level of the drawn lines at the left. Higher KV10.2 fluorescence densities are observed in the region of the plasma membrane.
Figure 8.
Figure 8.
ΔN-Cap KV10.2 characterization in transfected COS-7 cells. A, domains organization of the channel, showing the N-Cap deletion. B, representative, superimposed recordings of the ΔN-Cap KV10.2–1D4 current. Inset: voltage protocol used (one sweep every 8 s). C, representative confocal immunostainings of ΔN-Cap KV10.2–1D4 in transfected COS-7 cells (in green). WGA is used as a membrane marker (in red). Nuclei are stained with DAPI (in blue). Scale bar = 15 μm. D, mean ± S.E. fluorescence of the KV10.2 signal in plasma membrane (M1 and M2) and cytosol, as measured in E and F, normalized by the average KV10.2 fluorescence. E and F, left: expanded view of two selected cells, showing the Golgi (stars) and the line used for the line plots shown on the right. Lines have been placed as far as possible from the Golgi to generate accurate plasma membrane plots. Right: line plots of WGA (red) and KV10.2 (green) at the level of the drawn lines at the left. Higher KV10.2 fluorescence densities are not observed in the region of the plasma membrane, as opposed to the WT condition.
Figure 9.
Figure 9.
Δeag KV10.2 characterization in transfected COS-7 cells. A, domains organization of the channel, showing the eag domain deletion. B, representative, superimposed recordings of the Δeag KV10.2–1D4 current. Inset: voltage protocol used (one sweep every 8 s). C, representative confocal immunostainings of Δeag KV10.2–1D4 in transfected COS-7 cells (in green). WGA is used as a membrane marker (in red). Nuclei are stained with DAPI (in blue). Scale bar = 15 μm. D, mean ± S.E. fluorescence of KV10.2 signal in plasma membrane (M1 and M2) and cytosol, as measured in E and F, normalized by the average KV10.2 fluorescence. E and F, left: expanded view of two selected cells, showing the Golgi (stars) and the line used for the line plots shown at the right. Lines have been placed as far as possible from the Golgi to generate accurate plasma membrane plots. Right: line plots of WGA (red) and KV10.2 (green) at the level of the drawn lines at the left. Higher KV10.2 fluorescence densities are not observed in the region of the plasma membrane, as opposed to the WT condition.
Figure 10.
Figure 10.
ΔPAS KV10.2 characterization in transfected COS-7 cells. A, domains organization of the channel, showing the PAS domain deletion. B, representative, superimposed recordings of the ΔPAS KV10.2–1D4 current. Inset: voltage protocol used (one sweep every 8 s). C, representative confocal immunostainings of ΔPAS KV10.2–1D4 in transfected COS-7 cells (in green). WGA is used as a membrane marker (in red). Nuclei are stained with DAPI (in blue). Scale bar = 15 μm. D, mean ± S.E. fluorescence of KV10.2 signal in plasma membrane (M1 and M2) and cytosol, as measured in E and F, normalized by the average KV10.2 fluorescence. E and F, left: expanded view of two selected cells, showing the Golgi (stars) and the line used for the line plots shown at the right. Lines have been placed as far as possible from the Golgi to generate accurate plasma membrane plots. Right: line plots of WGA (red) and KV10.2 (green) at the level of the drawn lines at the left. Higher KV10.2 fluorescence densities are not observed in the region of the plasma membrane, as opposed to the WT condition.
Figure 11.
Figure 11.
Co-expression of WT and truncated KV10.2 channels uncovers a right shift in the activation curve, as compared with WT channel. A, domain organization of WT and truncated channels. B, representative, superimposed recordings of COS-7 cells transfected with WT KV10.2 channel (left), WT and ΔN-Cap KV10.2 (middle), and WT and Δeag KV10.2 (right). Inset, activation voltage protocol used (one sweep every 8 s). C, mean ± S.E. KV10.2 maximum tail-current density, in the indicated conditions. *, p < 0.05 versus WT, Mann-Whitney test. D, activation curve in the indicated conditions. E, mean ± S.E. half-activation potential (V0.5). ***, p < 0.001 versus WT, Student's t test. F, mean ± S.E. activation slope (k). ***, p < 0.001 versus WT, Student's t test.
Figure 12.
Figure 12.
Co-expression of WT and truncated KV10.2 channels is not associated with changes in deactivation kinetics, as compared with WT channel. A, representative, superimposed recordings of COS-7 cells transfected with WT KV10.2 channel (left), WT and ΔN-Cap KV10.2 (middle), and WT and Δeag KV10.2 (right). Upper inset: deactivation tail voltage protocol used (prepulse duration, 3 s, one sweep every 7 s). B, mean ± S.E. KV10.2 deactivation time constant, obtained from a monoexponential fit of the deactivating current.

References

    1. Yellen G. (2002) The voltage-gated potassium channels and their relatives. Nature 419, 35–42 10.1038/nature00978 - DOI - PubMed
    1. Charpentier F., Mérot J., Loussouarn G., and Baró I. (2010) Delayed rectifier K+ currents and cardiac repolarization. J. Mol. Cell Cardiol. 48, 37–44 10.1016/j.yjmcc.2009.08.005 - DOI - PubMed
    1. Pal S., Hartnett K. A., Nerbonne J. M., Levitan E. S., and Aizenman E. (2003) Mediation of neuronal apoptosis by Kv2.1-encoded potassium channels. J. Neurosci. 23, 4798–4802 10.1523/JNEUROSCI.23-12-04798.2003 - DOI - PMC - PubMed
    1. Jiménez-Perez L., Cidad P., Álvarez-Miguel I., Santos-Hipólito A., Torres-Merino R., Alonso E., de la Fuente M. Á., López-López J. R., and Pérez-García M. T. (2016) Molecular determinants of Kv1.3 potassium channels-induced proliferation. J. Biol. Chem. 291, 3569–3580 10.1074/jbc.M115.678995 - DOI - PMC - PubMed
    1. Piron J., Choveau F. S., Amarouch M. Y., Rodriguez N., Charpentier F., Mérot J., Baró I., and Loussouarn G. (2010) KCNE1-KCNQ1 osmoregulation by interaction of phosphatidylinositol-4,5-bisphosphate with Mg2+ and polyamines. J. Physiol. 588, 3471–3483 10.1113/jphysiol.2010.195313 - DOI - PMC - PubMed

Publication types

LinkOut - more resources