

Urea Cycle Sustains Cellular Energetics upon EGFR Inhibition in EGFR-Mutant NSCLC
- PMID: 30808730
- PMCID: PMC6548670
- DOI: 10.1158/1541-7786.MCR-18-1068
Urea Cycle Sustains Cellular Energetics upon EGFR Inhibition in EGFR-Mutant NSCLC
Abstract
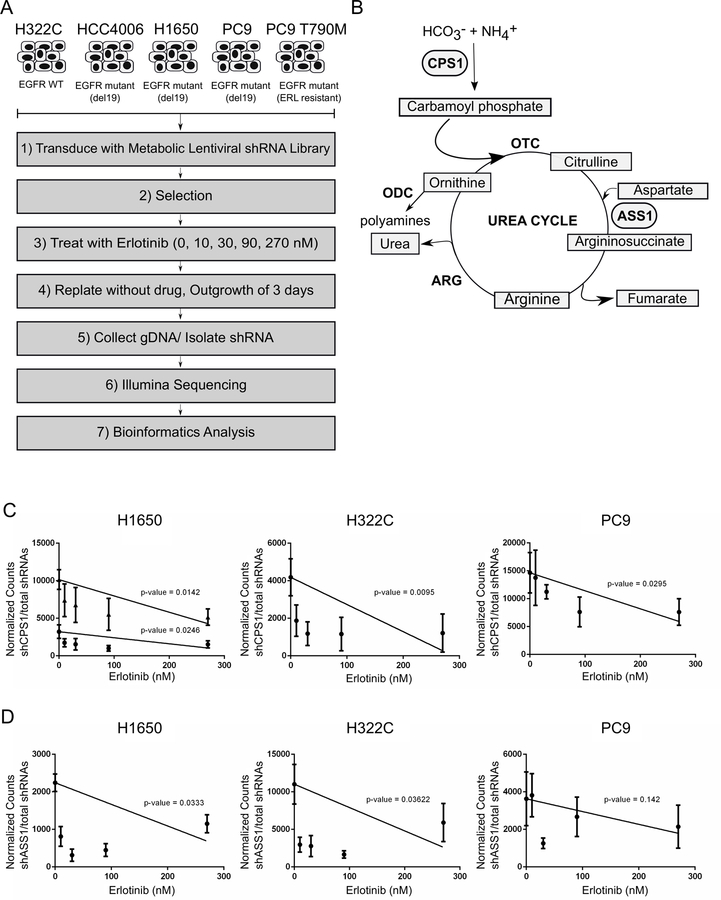
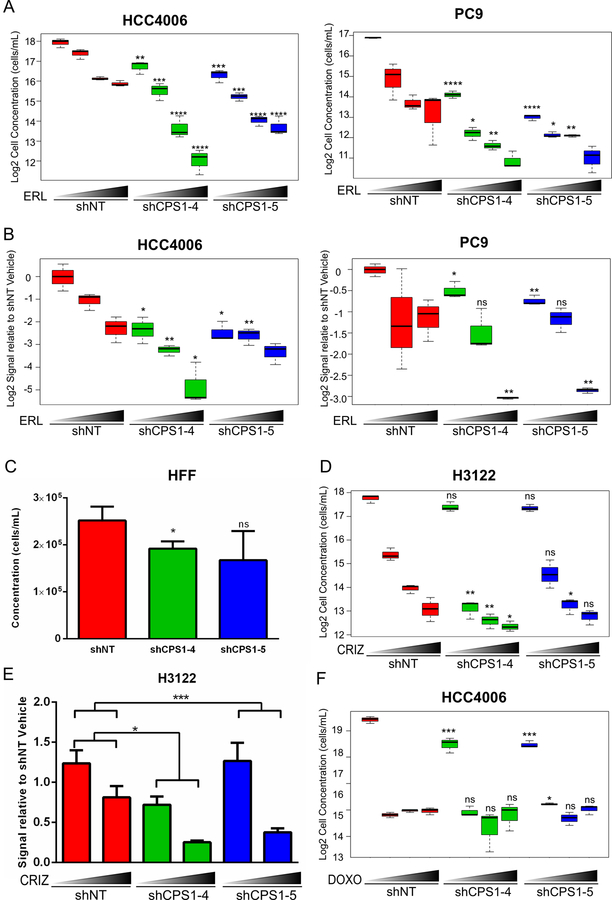
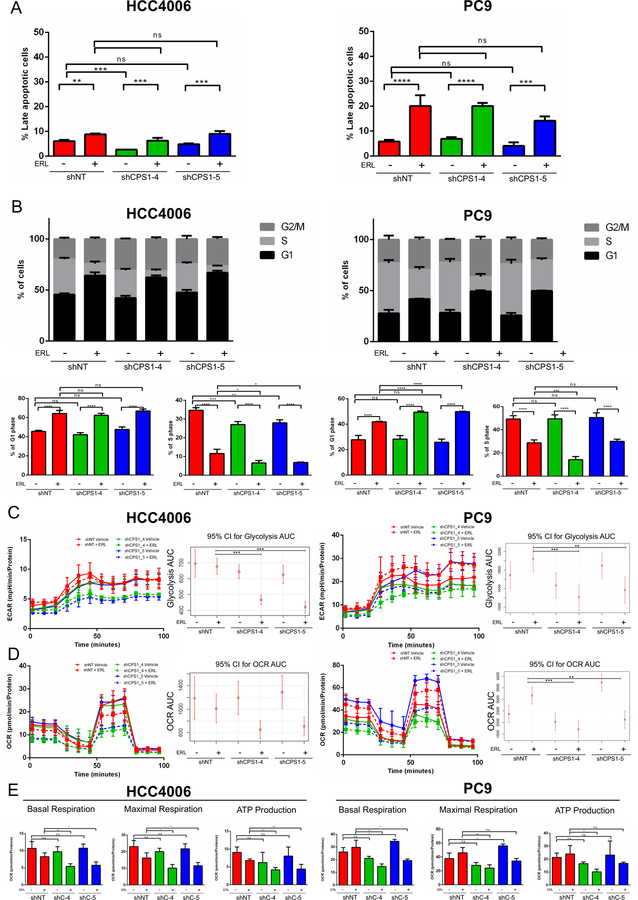
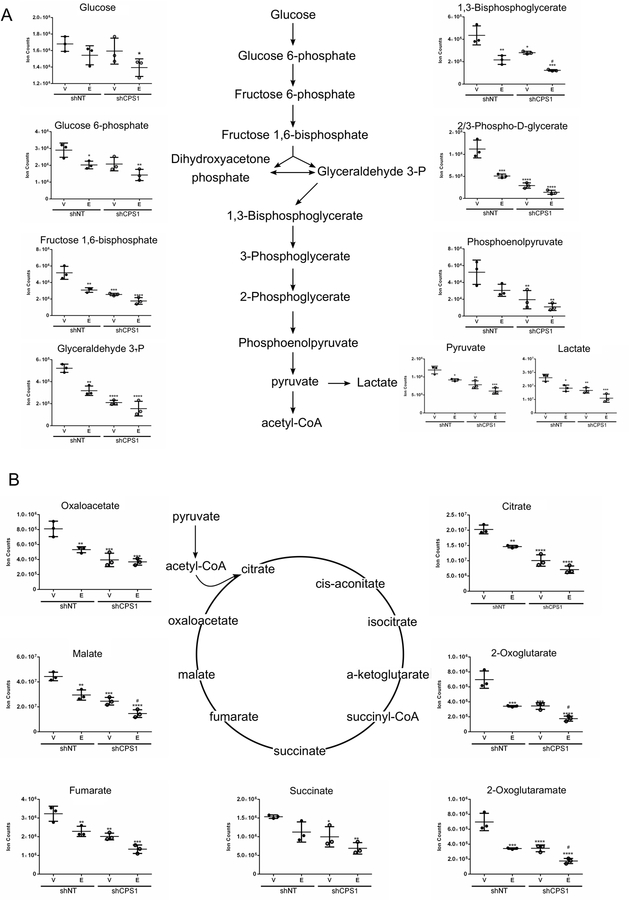
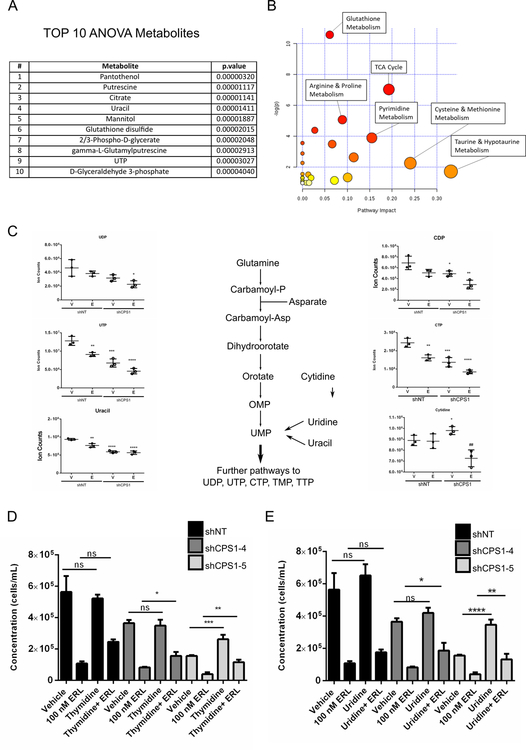
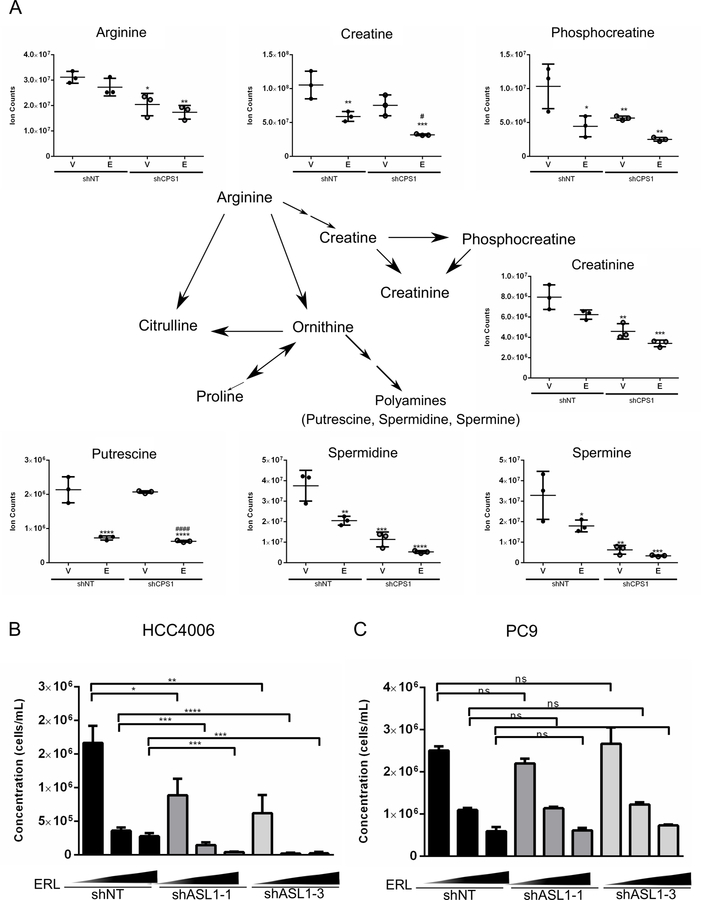
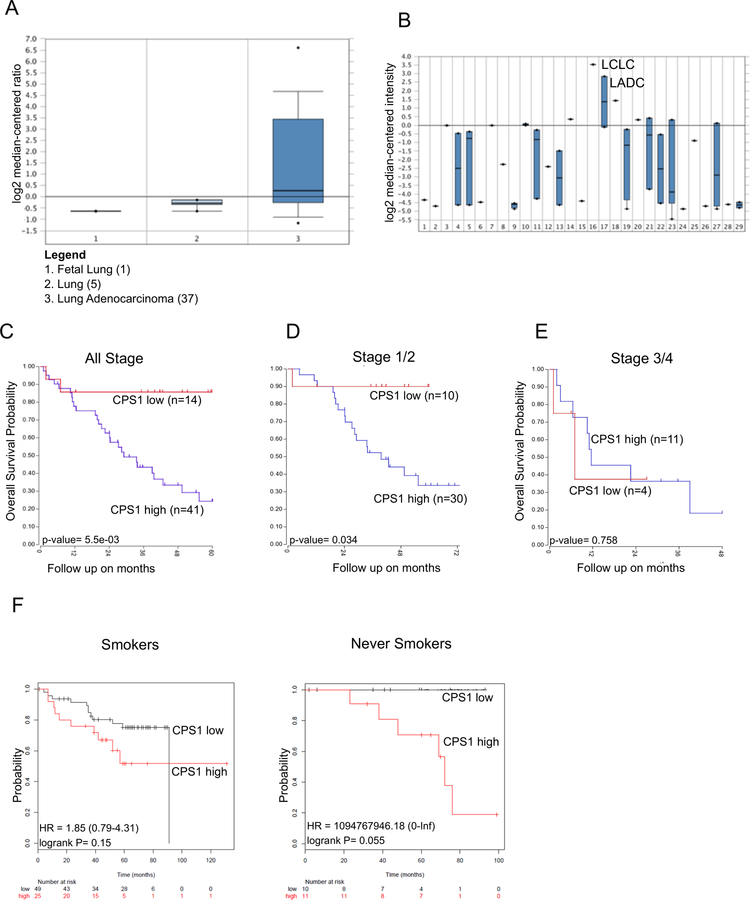
Mutations in oncogenes and tumor suppressor genes engender unique metabolic phenotypes crucial to the survival of tumor cells. EGFR signaling has been linked to the rewiring of tumor metabolism in non-small cell lung cancer (NSCLC). We have integrated the use of a functional genomics screen and metabolomics to identify metabolic vulnerabilities induced by EGFR inhibition. These studies reveal that following EGFR inhibition, EGFR-driven NSCLC cells become dependent on the urea cycle and, in particular, the urea cycle enzyme CPS1. Combining knockdown of CPS1 with EGFR inhibition further reduces cell proliferation and impedes cell-cycle progression. Profiling of the metabolome demonstrates that suppression of CPS1 potentiates the effects of EGFR inhibition on central carbon metabolism, pyrimidine biosynthesis, and arginine metabolism, coinciding with reduced glycolysis and mitochondrial respiration. We show that EGFR inhibition and CPS1 knockdown lead to a decrease in arginine levels and pyrimidine derivatives, and the addition of exogenous pyrimidines partially rescues the impairment in cell growth. Finally, we show that high expression of CPS1 in lung adenocarcinomas correlated with worse patient prognosis in publicly available databases. These data collectively reveal that NSCLC cells have a greater dependency on the urea cycle to sustain central carbon metabolism, pyrimidine biosynthesis, and arginine metabolism to meet cellular energetics upon inhibition of EGFR. IMPLICATIONS: Our results reveal that the urea cycle may be a novel metabolic vulnerability in the context of EGFR inhibition, providing an opportunity to develop rational combination therapies with EGFR inhibitors for the treatment of EGFR-driven NSCLC.
©2019 American Association for Cancer Research.
Conflict of interest statement
Conflicts of interest: The authors declare that they have no conflict of interest.
Figures
Similar articles
-
CPS1 maintains pyrimidine pools and DNA synthesis in KRAS/LKB1-mutant lung cancer cells.Nature. 2017 Jun 1;546(7656):168-172. doi: 10.1038/nature22359. Epub 2017 May 24. Nature. 2017. PMID: 28538732 Free PMC article.
-
Transcriptomic-metabolomic reprogramming in EGFR-mutant NSCLC early adaptive drug escape linking TGFβ2-bioenergetics-mitochondrial priming.Oncotarget. 2016 Dec 13;7(50):82013-82027. doi: 10.18632/oncotarget.13307. Oncotarget. 2016. PMID: 27852038 Free PMC article.
-
miR-19b enhances proliferation and apoptosis resistance via the EGFR signaling pathway by targeting PP2A and BIM in non-small cell lung cancer.Mol Cancer. 2018 Feb 19;17(1):44. doi: 10.1186/s12943-018-0781-5. Mol Cancer. 2018. PMID: 29455644 Free PMC article.
-
Epidermal Growth Factor Receptor (EGFR) Pathway, Yes-Associated Protein (YAP) and the Regulation of Programmed Death-Ligand 1 (PD-L1) in Non-Small Cell Lung Cancer (NSCLC).Int J Mol Sci. 2019 Aug 5;20(15):3821. doi: 10.3390/ijms20153821. Int J Mol Sci. 2019. PMID: 31387256 Free PMC article. Review.
-
Multimodal omics analysis of the EGFR signaling pathway in non-small cell lung cancer and emerging therapeutic strategies.Oncol Res. 2025 May 29;33(6):1363-1376. doi: 10.32604/or.2025.059311. eCollection 2025. Oncol Res. 2025. PMID: 40486879 Free PMC article. Review.
Cited by
-
CPS1-promoted the progression of lung adenocarcinoma via suppressing ammonia induced the activation of ROS/AMPK/P53/LKB1 signaling pathway.Sci Rep. 2025 Aug 12;15(1):29610. doi: 10.1038/s41598-025-14443-9. Sci Rep. 2025. PMID: 40796927 Free PMC article.
-
Define the Two Molecular Subtypes of Epithelioid Malignant Pleural Mesothelioma.Cells. 2022 Sep 19;11(18):2924. doi: 10.3390/cells11182924. Cells. 2022. PMID: 36139498 Free PMC article.
-
CPS1 expression and its prognostic significance in lung adenocarcinoma.Ann Transl Med. 2020 Mar;8(6):341. doi: 10.21037/atm.2020.02.146. Ann Transl Med. 2020. PMID: 32355785 Free PMC article.
-
Molecular Typing Based on Oxidative Stress Genes and Establishment of Prognostic Characteristics of 7 Genes in Lung Adenocarcinoma.Oxid Med Cell Longev. 2022 Sep 12;2022:9683819. doi: 10.1155/2022/9683819. eCollection 2022. Oxid Med Cell Longev. 2022. Retraction in: Oxid Med Cell Longev. 2023 Aug 9;2023:9841973. doi: 10.1155/2023/9841973. PMID: 36148413 Free PMC article. Retracted.
-
Dysregulated Metabolism in EGFR-TKI Drug Resistant Non-Small-Cell Lung Cancer: A Systematic Review.Metabolites. 2022 Jul 14;12(7):644. doi: 10.3390/metabo12070644. Metabolites. 2022. PMID: 35888768 Free PMC article. Review.
References
-
- Siegel RL, Miller KD, Jemal A. Cancer statistics, 2018. CA Cancer J Clin 2018; 68: 7–30. - PubMed
-
- Paez JG, Jänne PA, Lee JC, Tracy S, Greulich H, Gabriel S et al. EGFR Mutations in Lung Cancer: Correlation with Clinical Response to Gefitinib Therapy. Science (80- ) 2004; 304: 1497–1500. - PubMed
-
- Lynch TJ, Bell DW, Sordella R, Gurubhagavatula S, Okimoto RA, Brannigan BW et al. Activating Mutations in the Epidermal Growth Factor Receptor Underlying Responsiveness of Non–Small-Cell Lung Cancer to Gefitinib. N Engl J Med 2004; 350: 2129–2139. - PubMed
-
- Mok TS, Wu Y-L, Thongprasert S, Yang C-H, Chu D-T, Saijo N et al. Gefitinib or Carboplatin–Paclitaxel in Pulmonary Adenocarcinoma. N Engl J Med 2009; 361: 947–957. - PubMed
-
- Zhou C, Wu YL, Chen G, Feng J, Liu XQ, Wang C et al. Erlotinib versus chemotherapy as first-line treatment for patients with advanced EGFR mutation-positive non-small-cell lung cancer (OPTIMAL, CTONG-0802): a multicentre, open-label, randomised, phase 3 study. Lancet Oncol 2011; 12: 735–742. - PubMed
Publication types
MeSH terms
Substances
Grants and funding
LinkOut - more resources
Full Text Sources
Other Literature Sources
Medical
Research Materials
Miscellaneous
