. 2019 Feb 26;116(9):3703-3711.
doi: 10.1073/pnas.1814014116. Epub 2019 Feb 11.

Human complement factor H Y402H polymorphism causes an age-related macular degeneration phenotype and lipoprotein dysregulation in mice

Affiliations

Human complement factor H Y402H polymorphism causes an age-related macular degeneration phenotype and lipoprotein dysregulation in mice

Michael Landowski et al. Proc Natl Acad Sci U S A. .

Abstract

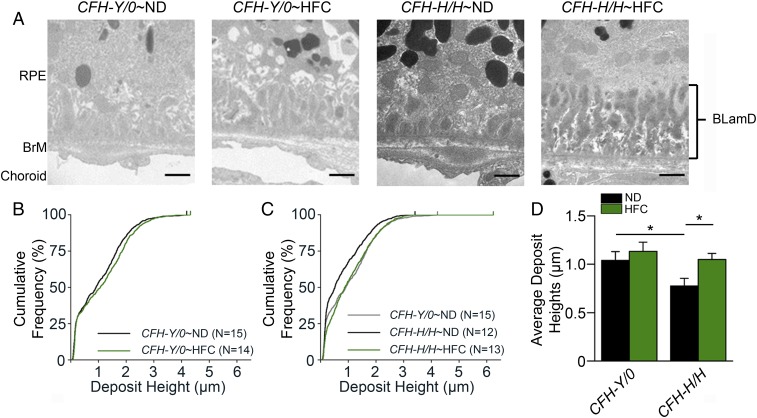
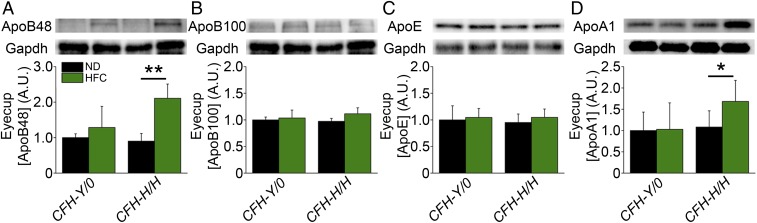
One of the strongest susceptibility genes for age-related macular degeneration (AMD) is complement factor H (CFH); however, its impact on AMD pathobiology remains unresolved. Here, the effect of the principal AMD-risk-associated CFH variant (Y402H) on the development and progression of age-dependent AMD-like pathologies was determined in vivo. Transgenic mice expressing equal amounts of the full-length normal human CFH Y402 (CFH-Y/0) or the AMD-risk associated CFH H402 (CFH-H/H) variant on a Cfh-/- background were aged to 90 weeks and switched from normal diet (ND) to a high fat, cholesterol-enriched (HFC) diet for 8 weeks. The resulting phenotype was compared with age-matched controls maintained on ND. Remarkably, an AMD-like phenotype consisting of vision loss, increased retinal pigmented epithelium (RPE) stress, and increased basal laminar deposits was detected only in aged CFH-H/H mice following the HFC diet. These changes were not observed in aged CFH-Y/0 mice or in younger (36- to 40-week-old) CFH mice of both genotypes fed either diet. Biochemical analyses of aged CFH mice after HFC diet revealed genotype-dependent changes in plasma and eyecup lipoproteins, but not complement activation, which correlated with the AMD-like phenotype in old CFH-H/H mice. Specifically, apolipoproteins B48 and A1 are elevated in the RPE/choroid of the aged CFH-H/H mice compared with age-matched control CFH-Y/0 fed a HFC diet. Hence, we demonstrate a functional consequence of the Y402H polymorphism in vivo, which promotes AMD-like pathology development and affects lipoprotein levels in aged mice. These findings support targeting lipoproteins as a viable therapeutic strategy for treating AMD.

Keywords: RPE; age-related macular degeneration; complement; genetic risk; lipoproteins.


Conflict of interest statement

The authors declare no conflict of interest.

Figures

Fig. 1.
Fig. 1.
AMD-like changes including decreased visual function and increased RPE stress occurs only in aged CFH-H/H∼HFC mice. (A) Scotopic ERG flash responses in aged (90+ wk) CFH mice fed an ND or HFC diet. Visual function was assessed by scotopic ERG and presented as fitted lines of the B-wave amplitude averages using the equation R = (Bmax1 × I/I + I1)/(Bmax2 × I/I + I2). No differences in the scotopic ERG B-wave responses were observed between aged CFH-Y/0∼ND (black), CFH-Y/0∼HFC (green) mice, and CFH-H/H∼HFC (blue). Only aged CFH-H/H∼HFC mice (pink) develop significant attenuated ERG B-wave responses compared with aged CFH-H/H∼ND mice. *P < 0.05 and **P < 0.01 post hoc Tukey, following a significant genotype by diet interaction by ANOVA for the B-wave amplitudes. (B) RPE stress as ascertained by RPE dysmorphia in aged CFH mice following HFC diet. Representative confocal fluorescence images (40× magnification) of RPE flat mounts near the optic nerve stained with Hoechst 33342 (blue, nuclei) and anti–ZO-1 (green) from aged CFH mice on ND and HFC diet. RPE dysmorphia in aged CFH mice was measured by the number of multinucleate (n ≥ 3 nuclei) RPE cells within each image. There are more multinucleate RPE cells in aged CFH-H/H∼HFC mice. (Scale bars, 50 μm.) (C) Quantitation of multinucleate (n ≥ 3 nuclei) RPE cells per field view in aged CFH mice on ND and HFC diet shows no change in the number of multinucleate RPE cells in aged CFH-Y/0∼ND (n = 8) and CFH-Y/0∼HFC (n = 8) mice. Aged CFH-H/H∼HFC mice (n = 11) have a statistically larger number of multinucleate cells per field view than CFH-H/H∼ND mice (n = 7). *P < 0.05 post hoc Tukey following a significant genotype by diet interaction by ANOVA for the mean number of multinucleate RPE cells. Data are presented as mean ± SEM.
Fig. 2.
Fig. 2.
Aged CFH-H/H∼HFC mice have increased BLamDs. (A) TEM images (15,000× magnification) of the region were used to quantitate the size of BLamDs in aged CFH-Y/0 and CFH-H/H mice on ND and HFC diet. Representative TEM images show that all aged CFH-Y/0 and CFH-H/H mice have BLamDs irrespective of diet treatment. However, deposits in aged CFH-H/H∼ND mice appear the smallest compared with the other groups in this study. (Scale bars, 1 μm.) (B) BLamD heights in aged CFH-Y/0∼ND and ∼HFC mice. BLamD heights were measured from the elastic layer of BrM to the top of the largest deposit within each TEM image. Cumulative frequencies of the BLamD heights were plotted against deposit height to illustrate the distribution of deposit heights for the genotype and diet. There is a slight shift to the right in the distribution of larger deposits and demonstrates an increase in deposit sizes in aged CFH-Y/0∼HFC mice (green) compared with aged CFH-Y/0∼ND mice (black). (C) Deposit heights in aged CFH-H/H∼ND and CFH-H/H∼HFC mice. Aged CFH-Y/0∼ND mice (gray) have larger deposits compared with aged CFH-H/H∼ND mice (black) but have similar deposits as those found in aged CFH-Y/0∼ND mice. (D) Averages of deposit heights in aged CFH mice after HFC diet. The deposit height averages replicate the trends observed in the cumulative frequency plots. *P < 0.05 post hoc Tukey following a significant genotype by diet interaction by ANOVA for the mean BLamD heights. Data are presented as mean ± SEM.
Fig. 3.
Fig. 3.
HFC diet-induced complement activation is CFH variant independent. (AD) Densitometric analysis of CFH (A), FB (B), C3/C3b/iC3b (C), and iC3b (D) immunoblots of plasmas from aged CFH∼ND and ∼HFC mice after fasting. Plasma CFH, FB, and C3/C3b/iC3b significantly increased in fasted CFH-Y/0∼HFC and CFH-H/H∼HFC mice compared with ND-fed controls but were no differences in the levels between the genotypes after HFC diet treatment (n = 4). (D) Plasma samples were reduced before loading to quantitate iC3b levels (n = 8). Both CFH-Y/0∼HFC and CFH-H/H∼HFC mice had significantly increased levels of plasma iC3b compared with ND fed controls and show similar levels of plasma complement activation between these genotypes after HFC diet. (E and F) Densitometric analysis of FB (E) and C3/C3b/iC3b (F) immunoblots of eyecups (RPE/BrM/choroid/sclera) from fasted, aged CFH∼ND and ∼HFC mice (n = 7). FB levels were significantly higher in fasted CFH-Y/0∼HFC and CFH-H/H∼HFC mice compared with ND fed controls but not different between the genotypes on an HFC diet. Interestingly, no statistically significant differences in the C3/C3b/iC3b levels were detected between the genotypes on ND versus HFC diet (n = 7). *P < 0.05 and **P < 0.01 post hoc Tukey following a significant genotype by diet interaction by ANOVA for the densitometric arbitrary units. Data are presented as mean ± SD.
Fig. 4.
Fig. 4.
Plasma lipoprotein levels are CFH variant dependent. (A) Total plasma cholesterol from fasted, aged CFH∼ND and ∼HFC mice. Both aged CFH-Y/0∼HFC (n = 11) and CFH-H/H∼HFC (n = 11) mice have statistically significant higher plasma cholesterol than age-matched CFH-Y/0∼ND (n = 8) and CFH-H/H∼HFC (n = 8) mice, respectively. Aged CFH-H/H∼HFC mice have statistically lower plasma cholesterol compared with aged CFH-Y/0∼HFC mice. (B and C) FPLC fractionation of plasma from fasted CFH∼HFC mice. (B) Following the HFC diet, cholesterol was detected in fractions corresponding to CMs/ VLDLs, LDLs, and HDLs. LDL fractions 17–21 and 25 were statistically higher in aged CFH-Y/0∼HFC mice (blue) compared with aged CFH-H/H∼HFC mice (pink). (C) The area under the fractionated lipoprotein curve were calculated for each lipoprotein class and confirmed higher plasma LDL levels in aged CFH-Y/0 mice after diet. (DG) Densitometric analysis of plasma ApoB48 (D), ApoB100 (E), ApoE (F), and ApoA1 (G) immunoblots of fasted, aged CFH∼ND, and ∼HFC mice (n = 8–12). ApoB48 levels were increased in both aged CFH∼HFC murine lines after HFC diet but no difference was observed between genotypes. ApoB100 was significantly higher in aged CFH-Y/0∼HFC mice compared with aged CFH-Y/0∼ND but was unchanged in CFH-H/H mice on ND or HFC diet. ApoE increased in both aged CFH mice lines on HFC diet compared with ND fed controls but aged CFH-Y/0∼HFC mice had higher levels of ApoE than CFH-H/H∼HFC mice. ApoA1 was unchanged in both genotypes after HFC diet. *P < 0.05, **P < 0.01, and ***P < 0.001 post hoc Tukey, respectively, following a significant genotype by diet interaction by ANOVA. Data are presented as mean ± SEM (AC) and mean ± SD (DG).
Fig. 5.
Fig. 5.
Posterior eyecup apolipoprotein levels are CFH variant dependent. Densitometric analysis of ApoB48 (A), ApoB100 (B), ApoE (C), and ApoA1 (D) immunoblots of eyecup (RPE/BrM/choroid/sclera) lysates isolated from fasted and PBS-perfused, aged CFH∼ND and ∼HFC mice (n = 4–7). ApoB48 levels were higher in HFC-fed mice, but only the difference reached statistical significance in the CFH-H/H genotype. ApoB100 and ApoE were unchanged after HFC diet in both genotypes. ApoA1 levels were increased significantly in aged CFH-H/H∼HFC compared with CFH-H/H∼ND mice and were unchanged in aged CFH-Y/0∼ND and ∼HFC mice. *P < 0.05 and **P < 0.01 post hoc Tukey following a significant genotype by diet interaction by ANOVA for the densitometric arbitrary units, respectively. Data are presented as mean ± SD. Loading control (Gapdh) images in (A) and (B) are from the same blot because representative ApoB48 (A) and ApoB100 (B) images originate from the same set of samples on the same blot. Both ApoB isoforms are labeled on the same blot by the anti-ApoB antibody.

Similar articles

Cited by

References

    1. Wong WL, et al. Global prevalence of age-related macular degeneration and disease burden projection for 2020 and 2040: A systematic review and meta-analysis. Lancet Glob Health. 2014;2:e106–e116. - PubMed
    1. Chew EY, et al. Age-Related Eye Disease Study Research Group Ten-year follow-up of age-related macular degeneration in the age-related eye disease study: AREDS report no. 36. JAMA Ophthalmol. 2014;132:272–277. - PMC - PubMed
    1. Fritsche LG, et al. Age-related macular degeneration: Genetics and biology coming together. Annu Rev Genomics Hum Genet. 2014;15:151–171. - PMC - PubMed
    1. Lambert NG, et al. Risk factors and biomarkers of age-related macular degeneration. Prog Retin Eye Res. 2016;54:64–102. - PMC - PubMed
    1. Seddon JM, et al. Rare variants in CFI, C3 and C9 are associated with high risk of advanced age-related macular degeneration. Nat Genet. 2013;45:1366–1370. - PMC - PubMed

Publication types