

Analysis of wheat gene expression related to the oxidative stress response and signal transduction under short-term osmotic stress
- PMID: 30808876
- PMCID: PMC6391441
- DOI: 10.1038/s41598-019-39154-w
Analysis of wheat gene expression related to the oxidative stress response and signal transduction under short-term osmotic stress
Abstract
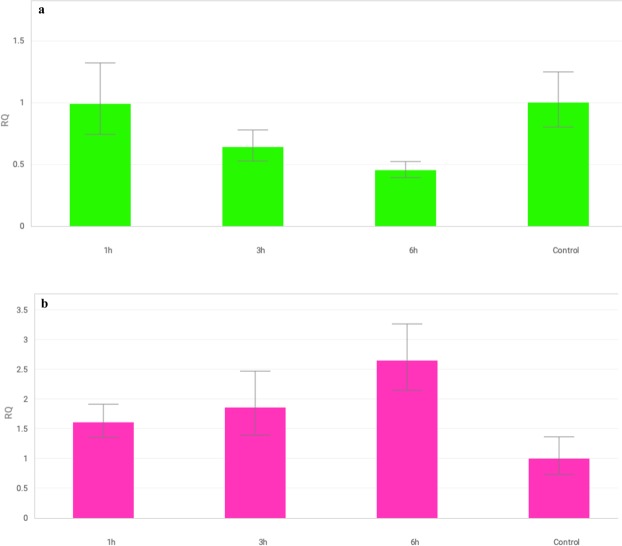
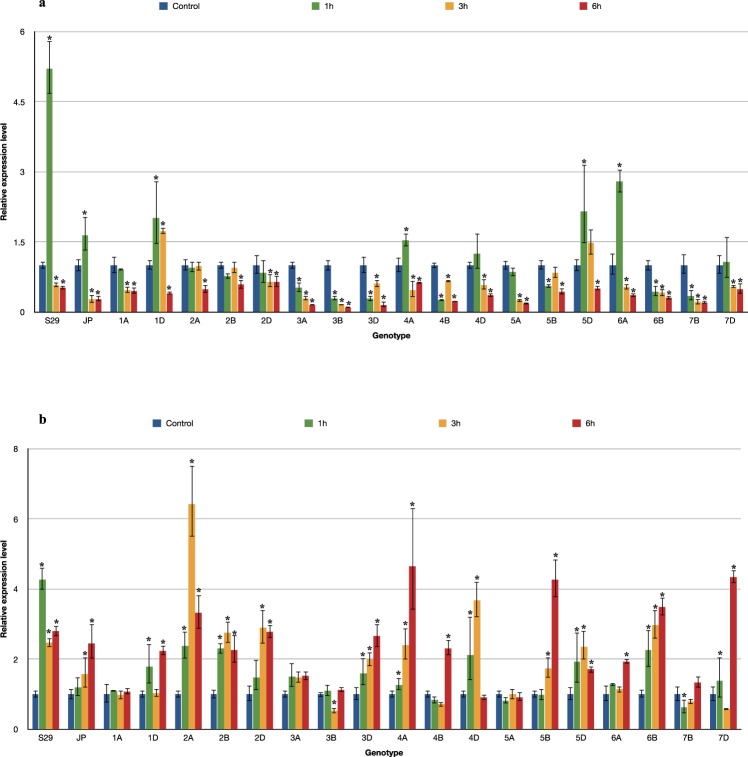
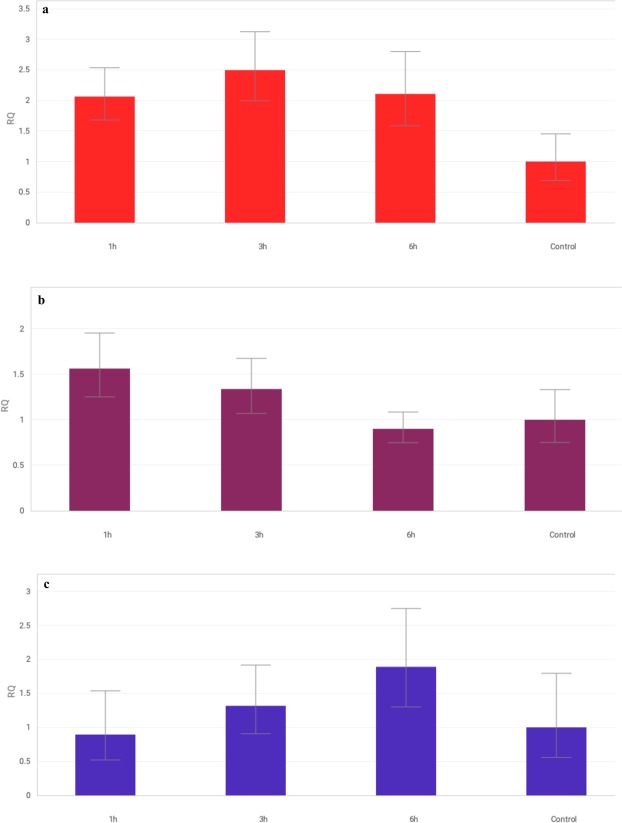
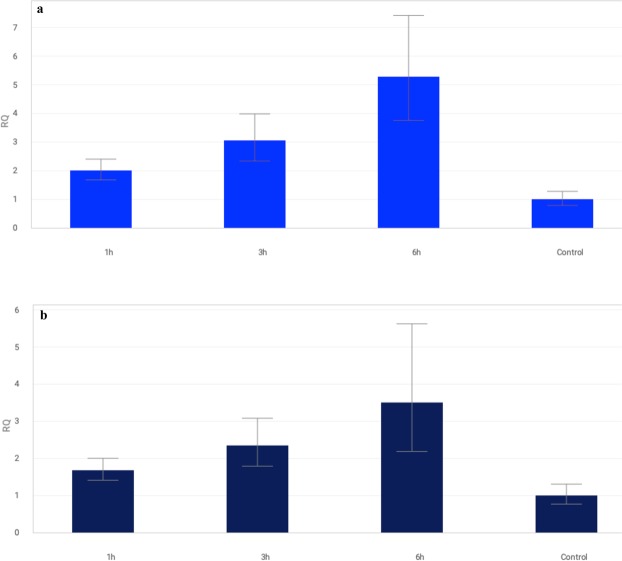
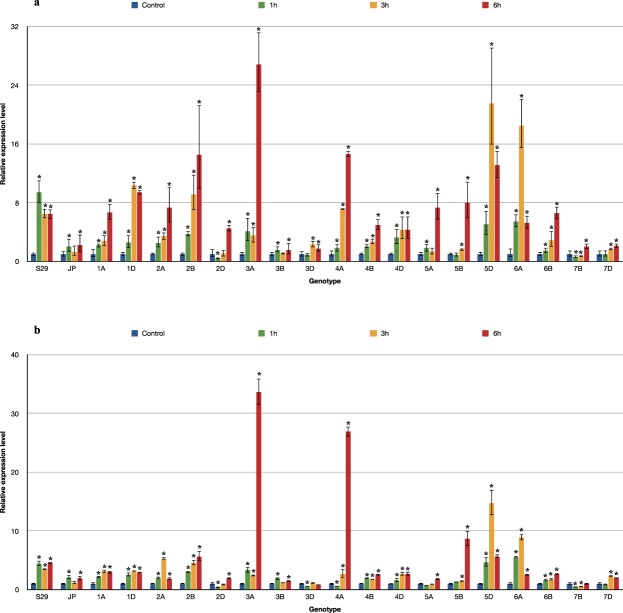
Water shortage is a major environmental stress that causes the generation of reactive oxygen species (ROS). The increase in ROS production induces molecular responses, which are key factors in determining the level of plant tolerance to stresses, including drought. The aim of this study was to determine the expression levels of genes encoding MAPKs (MAPK3 and MAPK6), antioxidant enzymes (CAT, APX and GPX) and enzymes involved in proline biosynthesis (P5CS and P5CR) in Triticum aestivum L. seedlings in response to short-term drought conditions. A series of wheat intervarietal substitution lines (ISCSLs) obtained by the substitution of single chromosomes from a drought-sensitive cultivar into the genetic background of a drought-tolerant cultivar was used. This source material allowed the chromosomal localization of the genetic elements involved in the response to the analyzed stress factor (drought). The results indicated that the initial plant response to drought stress resulted notably in changes in the expression of MAPK6 and CAT and both the P5CS and P5CR genes. Our results showed that the substitution of chromosomes 3B, 5A, 7B and 7D had the greatest impact on the expression level of all tested genes, which indicates that they contain genetic elements that have a significant function in controlling tolerance to water deficits in the wheat genome.
Conflict of interest statement
The authors declare no competing interests.
Figures

References
-
- Shiferaw B, et al. Crops that feed the world 10. Past successes and future challenges to the role played by wheat in global food security. Food Security. 2013;5(3):291–317. doi: 10.1007/s12571-013-0263-y. - DOI
-
- FAO FAOSTAT database collection. Food and Agriculture Organization of the United Nations. Rome. http://faostat.fao.org (2017).
-
- Zalibekov ZG. The arid regions of the world and their dynamics in conditions of modern climatic warming. Arid Ecosystems. 2011;1:1–7. doi: 10.1134/S2079096111010094. - DOI
-
- Maqsood M, Shehzad MA, Ahmad S, Mushtaq S. Performance of wheat (Triticum aestivum L.) genotypes associated with agronomical traits under water stress conditions. Asian Journal of Pharmaceutical and Biological Research. 2012;2:45–50.
MeSH terms
Substances
LinkOut - more resources
Full Text Sources
Miscellaneous
