

Cavitation dose painting for focused ultrasound-induced blood-brain barrier disruption
- PMID: 30808897
- PMCID: PMC6391404
- DOI: 10.1038/s41598-019-39090-9
Cavitation dose painting for focused ultrasound-induced blood-brain barrier disruption
Abstract
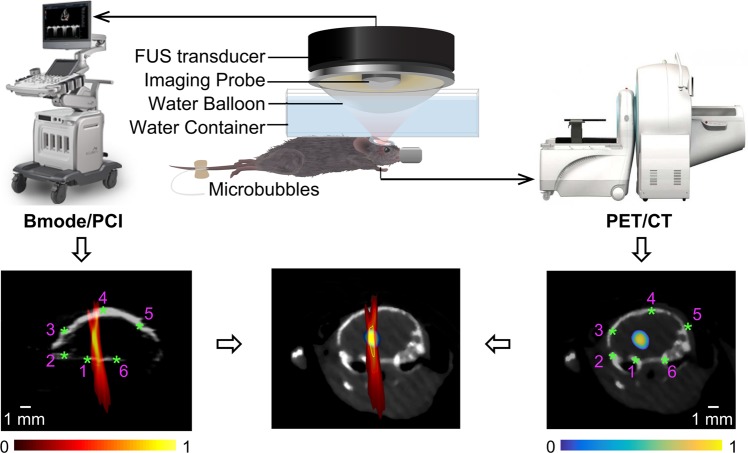
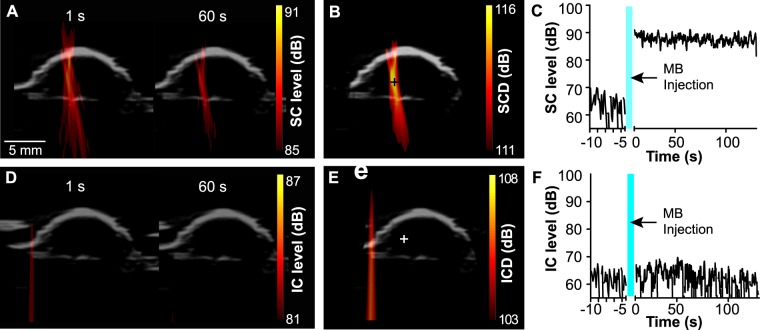
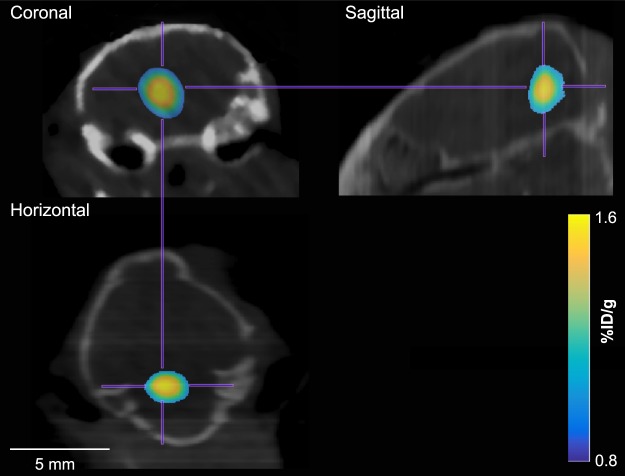
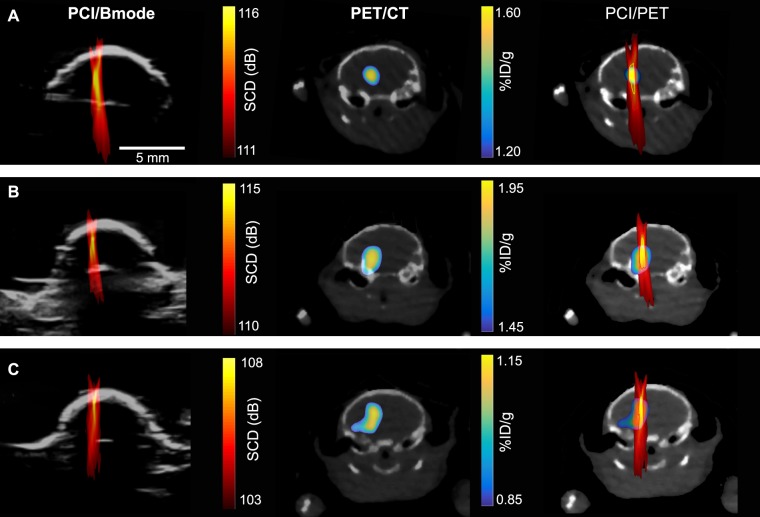
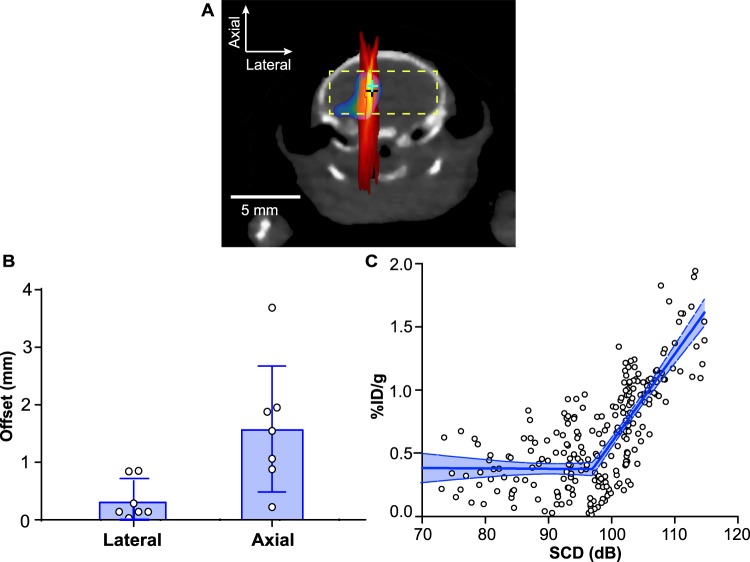
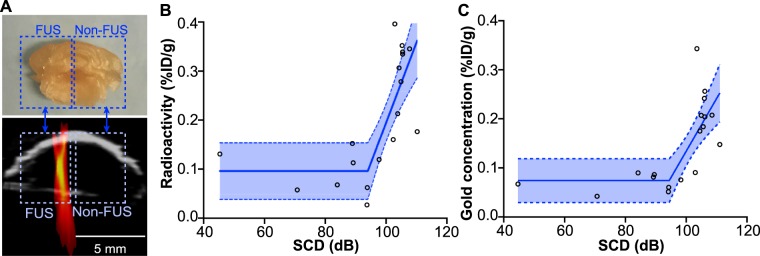
Focused ultrasound combined with microbubble for blood-brain barrier disruption (FUS-BBBD) is a promising technique for noninvasive and localized brain drug delivery. This study demonstrates that passive cavitation imaging (PCI) is capable of predicting the location and concentration of nanoclusters delivered by FUS-BBBD. During FUS-BBBD treatment of mice, the acoustic emissions from FUS-activated microbubbles were passively detected by an ultrasound imaging system and processed offline using a frequency-domain PCI algorithm. After the FUS treatment, radiolabeled gold nanoclusters, 64Cu-AuNCs, were intravenously injected into the mice and imaged by positron emission tomography/computed tomography (PET/CT). The centers of the stable cavitation dose (SCD) maps obtained by PCI and the corresponding centers of the 64Cu-AuNCs concentration maps obtained by PET coincided within 0.3 ± 0.4 mm and 1.6 ± 1.1 mm in the transverse and axial directions of the FUS beam, respectively. The SCD maps were found to be linearly correlated with the 64Cu-AuNCs concentration maps on a pixel-by-pixel level. These findings suggest that SCD maps can spatially "paint" the delivered nanocluster concentration, a technique that we named as cavitation dose painting. This PCI-based cavitation dose painting technique in combination with FUS-BBBD opens new horizons in spatially targeted and modulated brain drug delivery.
Conflict of interest statement
The authors declare no competing interests.
Figures
Similar articles
-
Focused ultrasound combined with microbubble-mediated intranasal delivery of gold nanoclusters to the brain.J Control Release. 2018 Sep 28;286:145-153. doi: 10.1016/j.jconrel.2018.07.020. Epub 2018 Jul 26. J Control Release. 2018. PMID: 30009893 Free PMC article.
-
Focused ultrasound-enabled delivery of radiolabeled nanoclusters to the pons.J Control Release. 2018 Aug 10;283:143-150. doi: 10.1016/j.jconrel.2018.05.039. Epub 2018 Jun 1. J Control Release. 2018. PMID: 29864474 Free PMC article.
-
Focused Ultrasound Enabled Trans-Blood Brain Barrier Delivery of Gold Nanoclusters: Effect of Surface Charges and Quantification Using Positron Emission Tomography.Small. 2018 Jul;14(30):e1703115. doi: 10.1002/smll.201703115. Epub 2018 Jul 2. Small. 2018. PMID: 29966035
-
Focused ultrasound blood-brain barrier disruption in high-grade gliomas: Scoping review of clinical studies.J Clin Neurosci. 2024 Oct;128:110786. doi: 10.1016/j.jocn.2024.110786. Epub 2024 Aug 14. J Clin Neurosci. 2024. PMID: 39146579
-
State of the art on microbubble cavitation monitoring and feedback control for blood-brain-barrier opening using focused ultrasound.Phys Med Biol. 2023 Sep 8;68(18). doi: 10.1088/1361-6560/ace23e. Phys Med Biol. 2023. PMID: 37369229 Review.
Cited by
-
Effect of high-frequency low-intensity pulsed electric field on protecting SH-SY5Y cells against hydrogen peroxide and β-amyloid-induced cell injury via ERK pathway.PLoS One. 2021 Apr 26;16(4):e0250491. doi: 10.1371/journal.pone.0250491. eCollection 2021. PLoS One. 2021. PMID: 33901243 Free PMC article.
-
Cavitation Emissions Nucleated by Definity Infused through an EkoSonic Catheter in a Flow Phantom.Ultrasound Med Biol. 2021 Mar;47(3):693-709. doi: 10.1016/j.ultrasmedbio.2020.10.010. Epub 2021 Jan 7. Ultrasound Med Biol. 2021. PMID: 33349516 Free PMC article.
-
A pre-clinical MRI-guided all-in-one focused ultrasound system for murine brain studies.Sci Rep. 2025 Jan 2;15(1):144. doi: 10.1038/s41598-024-84078-9. Sci Rep. 2025. PMID: 39747938 Free PMC article.
-
Using a novel rapid alternating steering angles pulse sequence to evaluate the impact of theranostic ultrasound-mediated ultra-short pulse length on blood-brain barrier opening volume and closure, cavitation mapping, drug delivery feasibility, and safety.Theranostics. 2023 Feb 5;13(3):1180-1197. doi: 10.7150/thno.76199. eCollection 2023. Theranostics. 2023. PMID: 36793858 Free PMC article.
-
Simultaneous High-Frame-Rate Acoustic Plane-Wave and Optical Imaging of Intracranial Cavitation in Polyacrylamide Brain Phantoms during Blunt Force Impact.Bioengineering (Basel). 2024 Jan 29;11(2):132. doi: 10.3390/bioengineering11020132. Bioengineering (Basel). 2024. PMID: 38391618 Free PMC article.
References
-
- Aryal M, Vykhodtseva N, Zhang YZ, Park J, McDannold N. Multiple treatments with liposomal doxorubicin and ultrasound-induced disruption of blood-tumor and blood-brain barriers improve outcomes in a rat glioma model. J. Control. Release. 2013;169:103–111. doi: 10.1016/j.jconrel.2013.04.007. - DOI - PMC - PubMed
Publication types
MeSH terms
Substances
Grants and funding
LinkOut - more resources
Full Text Sources
Miscellaneous
