. 2019 Feb 26;9(1):2795.
doi: 10.1038/s41598-019-38877-0.

Integrative analysis of postharvest chilling injury in cherry tomato fruit reveals contrapuntal spatio-temporal responses to ripening and cold stress

Affiliations

Integrative analysis of postharvest chilling injury in cherry tomato fruit reveals contrapuntal spatio-temporal responses to ripening and cold stress

Karin Albornoz et al. Sci Rep. .

Abstract

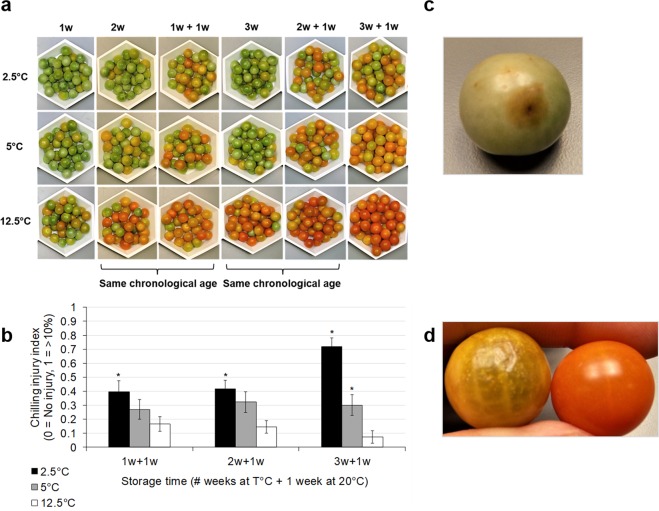
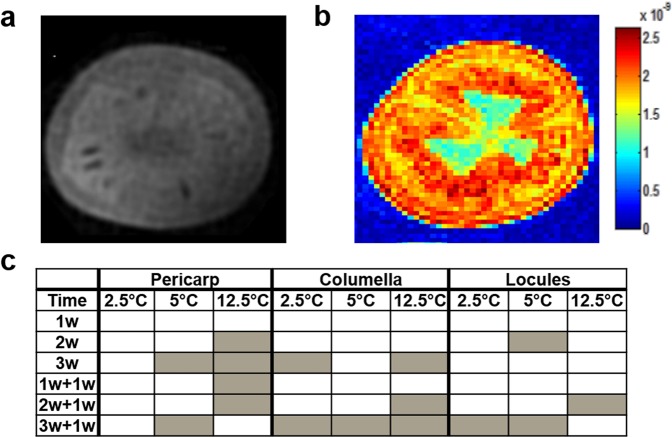
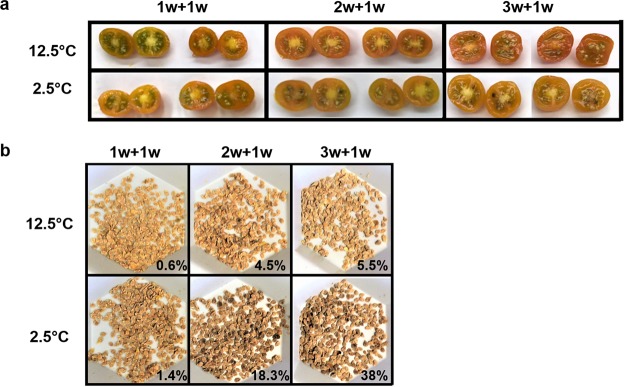
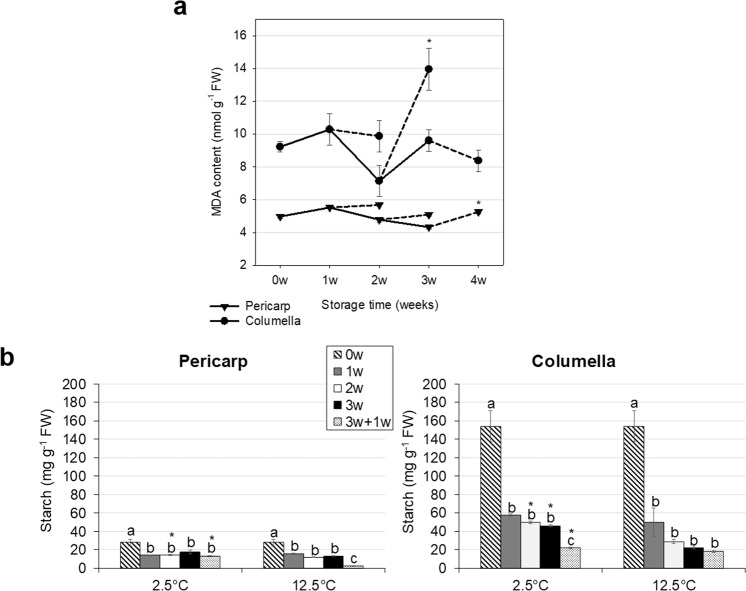
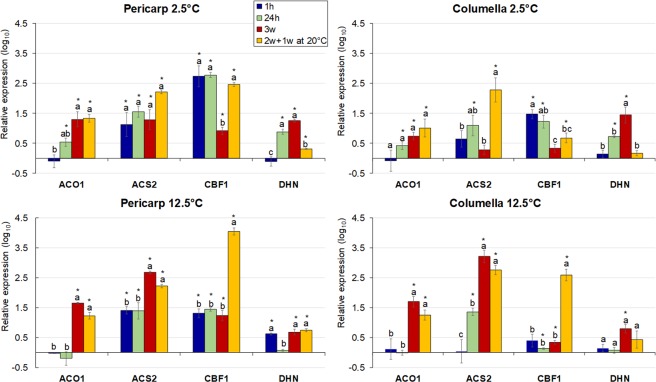
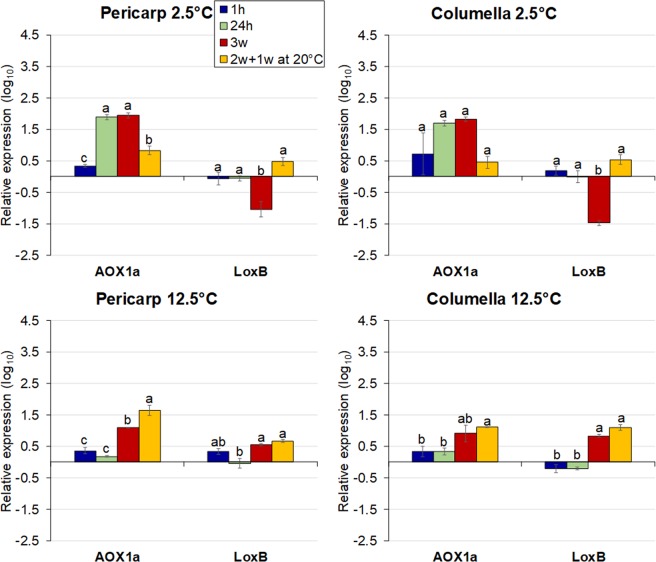
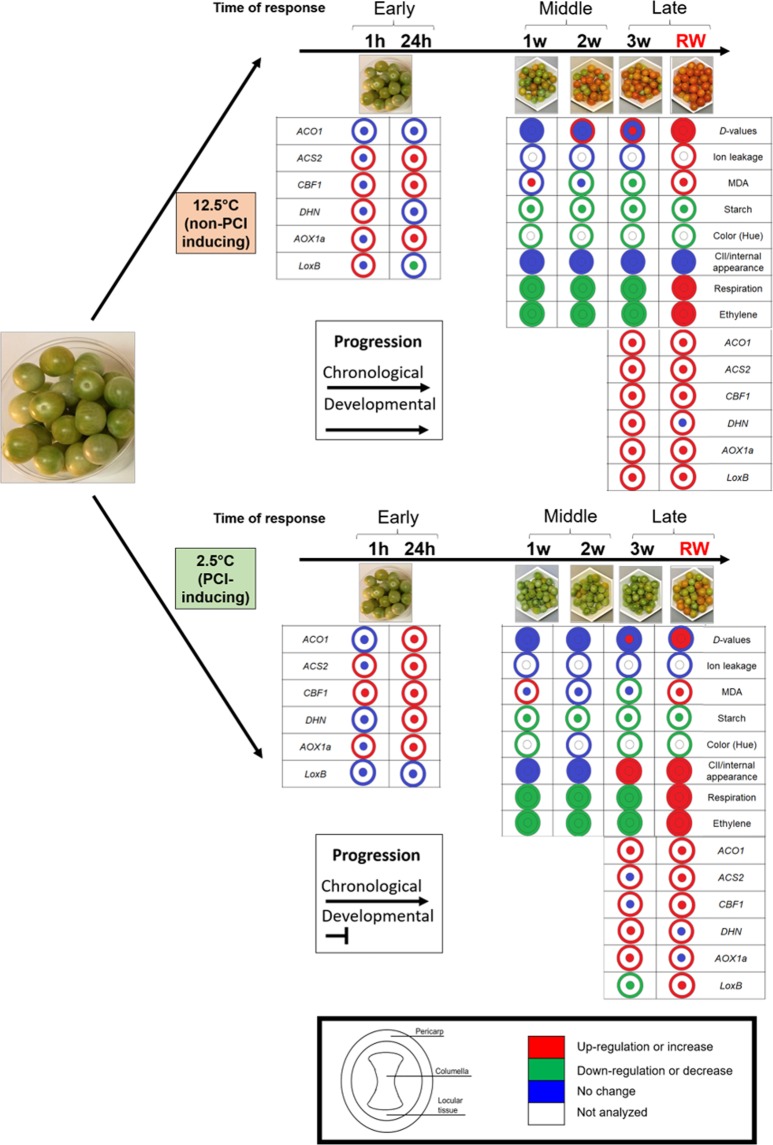
Postharvest chilling injury (PCI) reduces fruit quality and shelf-life in tomato (Solanum lycopersicum L.). PCI has been traditionally studied in the pericarp, however its development is likely heterogeneous in different fruit tissues. To gain insight into PCI's spatio-temporal development, we used postharvest biomarkers e.g. respiration and ethylene rates, ion leakage etc., to confirm the occurrence of PCI, and compared these data with molecular (gene expression), biophysical (MRI data) and biochemical parameters (Malondialdehyde (MDA) and starch content) from the pericarp or columella. Tissues were stored at control (12.5 °C) or PCI-inducing temperatures (2.5 or 5 °C) followed by rewarming at 20 °C. MRI and ion leakage revealed that cold irreversibly impairs ripening-associated membrane liquefaction; MRI also showed that the internal and external fruit tissues responded differently to cold. MDA and especially starch contents, were affected by chilling in a tissue-specific manner. The expression of the six genes studied: ACO1 and ACS2 (ripening), CBF1 (cold response), DHN, AOX1a and LoxB (stress-related) showed non-overlapping temporal and spatially-specific responses. Overall, the data highlighted the interconnectedness of fruit cold response and ripening, and showed how cold stress reconfigures the latter. They further underscored that multidimensional spatial and temporal biological studies are needed to develop effective solutions to PCI.


Conflict of interest statement

The authors declare no competing interests.

Figures

Figure 1
Figure 1
External changes in breaker cherry tomato fruit cv. Sungold after storage. (a) Effect of temperature and storage time. Fruit were kept at 2.5, 5 or 12.5 °C for 3 weeks. After 1 (‘1w + 1w’), 2 (‘2w + 1w’) and 3 (‘3w + 1w’) weeks fruit were transferred to 20 °C for 1 week. (b) Chilling injury index (mean ± SE). Each column represents the average of 32 fruit per treatment. Columns with asterisks are significantly different (p < 0.05) compared to the control (12.5 °C) at a given time point by Kruskal-Wallis test. (c) Image of fruit showing decay. Fruit were stored at 2.5 °C for 3 weeks followed by 1 week at 20 °C. (d) Images of fruit showing surface pitting. Fruit stored at 2.5 °C for 3 weeks followed by 1 week at 20 °C showing signs of surface pitting (left) and control with no pitting, in fruit stored at 12.5 °C for 3 weeks followed by 1 week at 20 °C (right).
Figure 2
Figure 2
MRI analysis of an equatorial slice of breaker cherry tomato fruit after cold-storage and rewarming. Fruit were kept at 2.5, 5 and 12.5 °C for 3 weeks. After 1 (‘1w + 1w’), 2 (‘2w + 1w’) and 3 (‘3w + 1w’) weeks fruit were transferred to 20 °C for 1 week. (a) MRI scan. (b) Apparent diffusion coefficient map of an equatorial slice of cherry tomato fruit. The color scale is shown in the color bar. Voxels in red and blue have high and low D-values, respectively. (c) Schematic representation of D-values measured in three fruit tissues. Values within each tissue and temperature were compared to the control which were freshly harvested fruit. Each cell represents 4 replicates, each of them containing 3 fruit. Grey color cells indicate significant differences (p < 0.05) and white cells indicate non-significant differences (p ≥ 0.05) by Dunnett’s test.
Figure 3
Figure 3
Internal changes of cherry tomato fruit after cold storage and rewarming. Fruit were stored for either 1 (‘1w + 1w’), 2 (‘2w + 1w’) or 3 (‘3w + 1w’) weeks followed by 1 week rewarming. (a) Cross-section of stored fruit. (b) Seeds extracted from stored fruit and percentages of seeds showing signs of browning and discoloration.
Figure 4
Figure 4
Malondialdehyde (MDA) and starch contents of stored cherry tomato fruit. (a) MDA content (mean ± SE) of fruit stored at 2.5 °C, over 3 weeks. After each week of storage, fruit were transferred to 20 °C for 1 week (dashed lines). Each symbol represents the average of 8 fruit per treatment. Asterisks indicate significant differences (p < 0.05) between cold storage and the same time point followed by rewarming for 1 week by unpaired t-test. (b) Starch content (mean ± SE) of fruit stored at 2.5 °C or 12.5 °C up to 3 weeks. After 3 weeks fruit were transferred to 20 °C for 1 week (‘3w + 1w’). Each column represents the average of 6 fruit per treatment. Different letters indicate significant differences (p < 0.05) between time points at each tissue and temperature by Tukey’s test. Asterisks indicate differences (p < 0.05) between 2.5 °C and 12.5 °C at the same time point by unpaired t-test.
Figure 5
Figure 5
Relative gene expression in the pericarp and columella of cherry tomato fruit. Fruit were stored at 2.5 or 12.5 °C for 1 h, 24 h, 3 weeks, or 2 weeks followed by 1 week at 20 °C. Freshly-harvested breaker fruit were used as the calibrator. Each symbol represents the average of 3 fruit per treatment. Values are the (log10) of the mean ± SE. Different letters indicate significant differences (p < 0.05) between time points at each tissue and temperature by Tukey’s test. Columns with asterisks are significantly different (p < 0.05) compared to the calibrator by unpaired t-test.
Figure 6
Figure 6
Relative gene expression in the pericarp and columella of cherry tomato fruit. Fruit were stored at 2.5 or 12.5 °C for 1 h, 24 h, 3 weeks, or 2 weeks followed by 1 week at 20 °C. Freshly-harvested breaker fruit were used as the calibrator. Each symbol represents the average of 3 fruit per treatment. Values are the (log10) of the mean ± SE. Different letters indicate significant differences (p < 0.05) between time points at each tissue and temperature by Tukey’s test. Columns with asterisks are significantly different (p < 0.05) compared to the calibrator by unpaired t-test.
Figure 7
Figure 7
Principal component analysis of the expression of genes in the pericarp and columella of cherry tomato fruit. Data shown here are from fruit kept at 2.5 for 3 weeks or 2 weeks followed by 1 week at 20 °C (‘RW’). Each symbol represents the relative expression values of all genes analyzed per sample, reduced to the first and second principal components. Equal symbols represent biological replicates for the same tissue and time point.
Figure 8
Figure 8
Schematic summary of the effect of storage temperature on the responses of parameters measured in the pericarp, columella or locular tissues of cherry tomato fruit. Fruit were stored at 12.5 °C or 2.5 °C, up to 3 weeks, or followed by storage at 20 °C (rewarming, ‘RW’). Trends of data (increase, decrease or no change), rather than magnitude changes are depicted, and were determined using freshly harvested fruit as the control. Fruit stored at 12.5 °C were compared against harvested breaker fruit so that the data reflected both chronologically and developmental differences. Except for CII and internal appearance, there were no PCI symptoms observed, therefore all other significant changes were related to ripening. PCI disrupts the normal progression of ripening. Comparing cold-stored (2.5 °C) fruit at each time point against harvested breaker fruit, informs on changes between fruit that are also chronologically different, but developmentally closer since cold suppresses maturation. In contrast to fruit at 12.5 °C, the array of changes associated with ripening was not obvious, and in addition, there were cold-injury responses. For the parameters where different tissues were analyzed, the manifestation of these traits could be described as contrapuntal, evidenced as heterogeneity and the decoupling of their response to cold compared to the control.

References

    1. Kader, A. Postharvest Biology and Technology: An Overview in Postharvest Technology for Horticultural Crops (ed. Kader, A.) 39–47 (UCANR, 2002).
    1. Lyons JM. Chilling injury in plants. Annual Review of Plant Physiology and Plant Molecular Biology. 1973;24:445–466. doi: 10.1146/annurev.pp.24.060173.002305. - DOI
    1. Jackman RL, Yada RY, Marangoni A, Parkin KL, Stanley DW. Chilling injury - A review of quality aspects. Journal of Food Quality. 1989;11:253–278. doi: 10.1111/j.1745-4557.1988.tb00887.x. - DOI
    1. Paul, R. E. Chilling Injury of Crops of Tropical and Subtropical Origin in Chilling injury of horticultural crops (ed. Wang, C. Y.) 17–36 (CRC Press, 1990).
    1. Parkin K, Marangoni A, Jackman R, Yada R, Stanley D. Chilling injury. A review of possible mechanisms. Journal of Food Biochemistry. 1989;13:127–153. doi: 10.1111/j.1745-4514.1989.tb00389.x. - DOI

Publication types

MeSH terms