Randomized Controlled Trial
. 2019 Feb 26;9(1):2828.
doi: 10.1038/s41598-019-38738-w.

Randomized controlled trial on the influence of dietary intervention on epigenetic mechanisms in children with cow's milk allergy: the EPICMA study

Affiliations
Randomized Controlled Trial

Randomized controlled trial on the influence of dietary intervention on epigenetic mechanisms in children with cow's milk allergy: the EPICMA study

Lorella Paparo et al. Sci Rep. .

Erratum in

Abstract

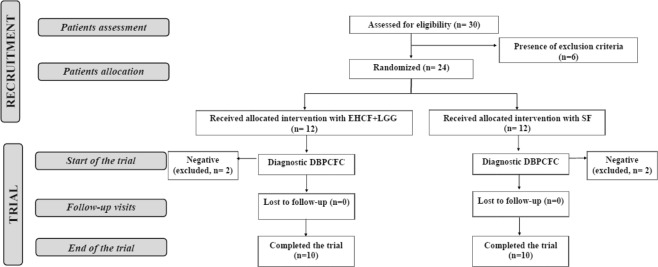
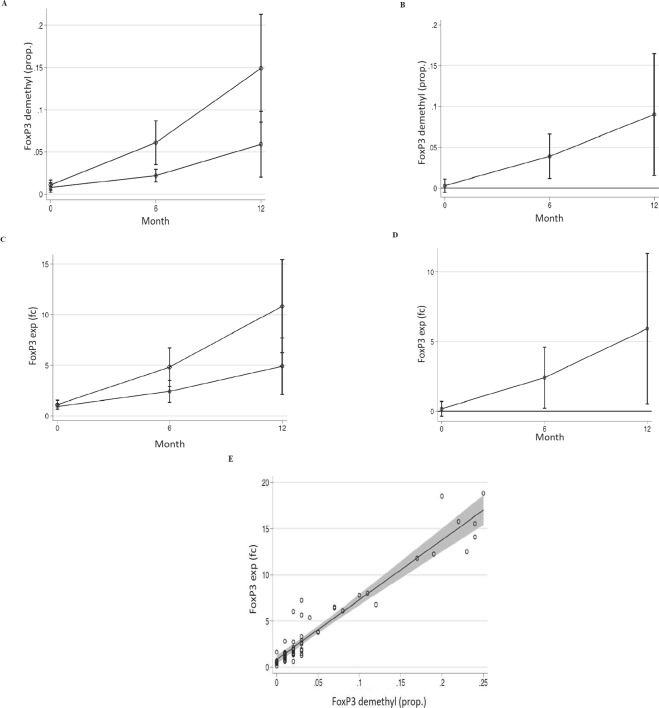
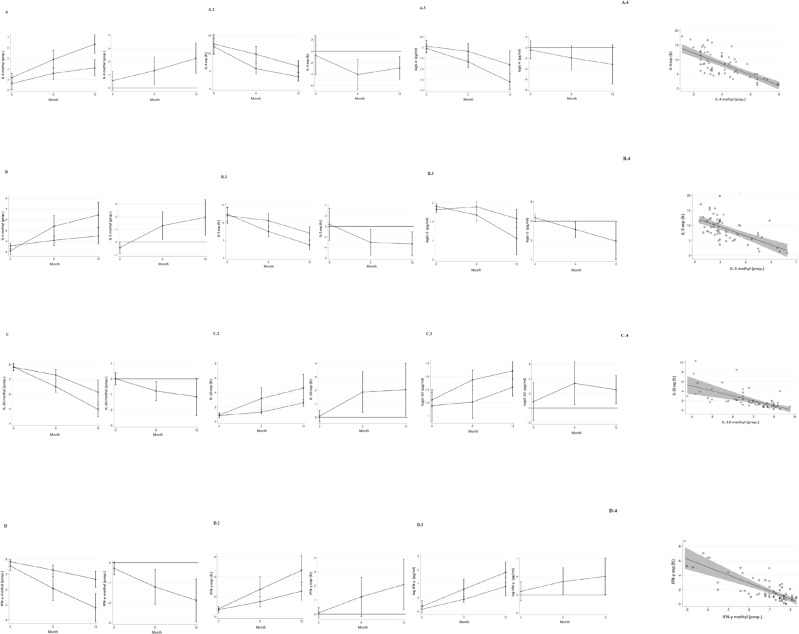
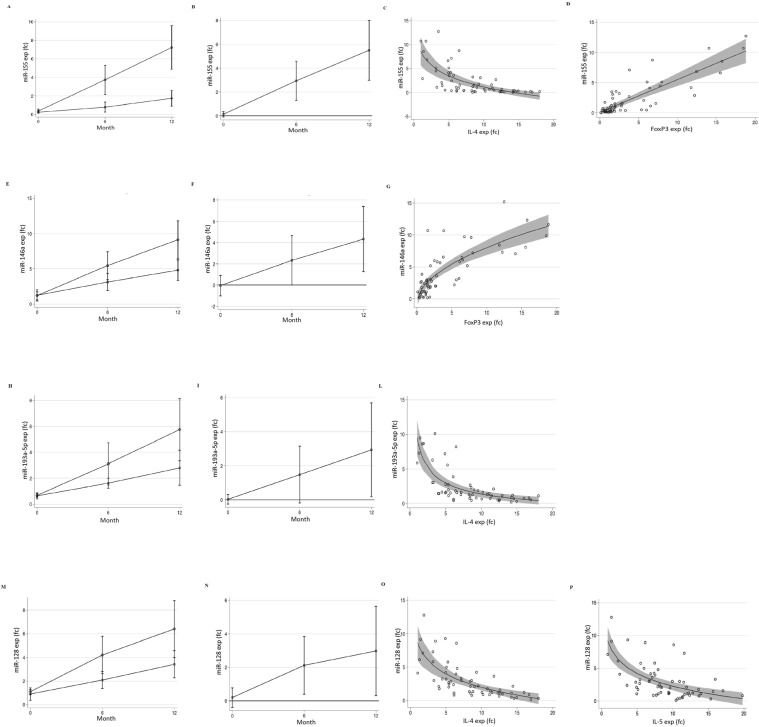
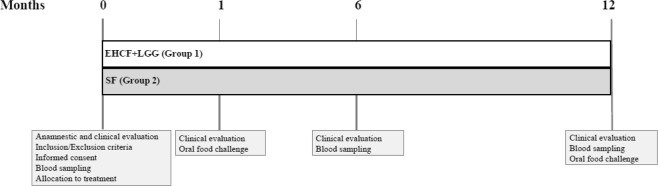
Epigenetic mechanisms could drive the disease course of cow's milk allergy (CMA) and formula choice could modulate these pathways. We compared the effect of two different dietary approaches on epigenetic mechanisms in CMA children. Randomized controlled trial on IgE-mediated CMA children receiving a 12-month treatment with extensively hydrolyzed casein formula containing the probiotic L.rhamnosus GG (EHCF + LGG) or with soy formula (SF). At the baseline, after 6 and 12 months of treatment FoxP3 methylation rate and its expression in CD4+ T cells were assessed. At same study points IL-4, IL-5, IL-10, and IFN-γ methylation rate, expression and serum concentration, miRNAs expression were also investigated. 20 children (10/group) were evaluated. Baseline demographic, clinical and epigenetic features were similar in the two study groups. At 6 and 12 months, EHCF + LGG group showed a significant increase in FoxP3 demethylation rate compared to SF group. At the same study points, EHCF + LGG group presented a higher increase in IL-4 and IL-5 and a higher reduction in IL-10 and IFN-γ DNA methylation rate compared to SF group. A different modulation of miR-155, -146a, -128 and -193a expression was observed in EHCF + LGG vs. SF. Dietary intervention could exert a different epigenetic modulation on the immune system in CMA children.


Conflict of interest statement

The authors declare no competing interests.

Figures

Figure 1
Figure 1
The flow of the patients through the study.
Figure 2
Figure 2
FoxP3 DNA demethylation and expression. (A) FoxP3 Treg-specific demethylated region (TSDR) demethylation proportion in children enrolled in the EHCF + LGG group (square) vs. soy group (circle). (B) FoxP3 TSDR demethylation proportion resulted significantly different comparing the two groups at 6 and at 12 months. EHCF + LGG group showed a higher FoxP3 demethylation proportion compared to SF group (p < 0.05). (C) FoxP3 expression in children enrolled in the EHCF + LGG group (square) vs. soy group (circle). (D) FoxP3 expression resulted significantly different comparing the two groups at 6 and at 12 months (p < 0.05). (E) Significant association was observed between FoxP3 expression and FoxP3 demethylation proportion in all study subjects at all study points (p < 0.01). Plotted values are means and 95% cluster confidence intervals estimated from generalized linear models for fractional or continuous outcomes (see statistical analysis for details). Statistical significance at a p-value < 0.05 is present when the 95% confidence interval of the difference does not cross 0.
Figure 3
Figure 3
IL-4, IL-5, IL-10, and IFN-γ DNA methylation, expression, and serum levels Time-related changes in IL-4 (A), IL-5 (B) and IL-10 (C), IFN-γ (D) genes methylation proportion, their expression and serum levels in the EHCF + LGG group (square) vs. soy group (circle). The statistical differences between the two groups at 6 and 12 months are represented at right side of each panel (p < 0.05). There was an association between expression and methylation proportion in all study subjects and time points (p < 0.01). Plotted values are means and 95% cluster confidence intervals estimated from generalized linear models for fractional or continuous outcomes (see statistical analysis for details). Statistical significance at a p-value < 0.05 is present when the 95% confidence interval of the difference does not cross 0.
Figure 4
Figure 4
miRNAs expression and their correlation with Th2 cytokines and FoxP3 expression (A) Time- related changes in miR-155 expression in the EHCF + LGG group (square) vs. soy group (circle). (B) Significant difference in miR-155 expression was observed at 6 and 12 months comparing the two study groups (p < 0.05). A significant association was found with IL-4 (C) and FoxP3 (D) expression in all study subjects and time points (p < 0.01). (E) Time- related changes in miR-146a expression in the EHCF + LGG group (square) vs. soy group(circle). (F) Significant difference in miR-146a expression was observed at 12 months comparing the two study groups (p < 0.05). (G) Significant association with FoxP3 expression was found in all study subjects and time points (p < 0.01). (I) Time-related changes in miR-193a5p expression in the EHCF + LGG group (square) vs. soy group (circle). (H) Significant difference in miR-193a5p expression was observed comparing the two study groups at 12 months (p < 0.05). (L) Significant association with and IL-4 expression was found in all study subjects and time points (p < 0.01). (M) Time-related changes in miR-128 expression in the EHCF + LGG group (square) vs. soy group (circle). (N) Significant difference in miR-128 expression was observed comparing the two study groups at 6 and 12 months (p < 0.05). A significant association with IL-4 (O) and IL-5 (P) expression was found in all study subjects and time points (p < 0.01). Plotted values are means and 95% cluster confidence intervals estimated from generalized linear models for fractional or continuous outcomes (see statistical analysis for details). Statistical significance at a p-value < 0.05 is present when the 95% confidence interval of the difference does not cross 0.
Figure 5
Figure 5
The design of the study.

References

    1. Ruszczyński M, Horvath A, Dziechciarz P, Szajewska H. Cow’s milk allergy guidelines: a quality appraisal with the AGREE II instrument. Clin Exp Allergy. 2016;46:1236–1240. doi: 10.1111/cea.12784. - DOI - PubMed
    1. Berni Canani R, et al. Extensively hydrolyzed casein formula containing Lactobacillus rhamnosus GG reduces the occurrence of other allergic manifestations in children with cow’s milk allergy: 3-year randomized controlled trial. J Allergy Clin Immunol. 2017;139:1906–1913.e4. doi: 10.1016/j.jaci.2016.10.050. - DOI - PubMed
    1. Paparo L, et al. The influence of early life nutrition on epigenetic regulatory mechanisms of the immune system. Nutrients. 2014;6:4706–4719. doi: 10.3390/nu6114706. - DOI - PMC - PubMed
    1. Ho SM. Enviromental epigenetics of asthma:an update. J Allergy Clin Immunol. 2010;126:453–465. doi: 10.1016/j.jaci.2010.07.030. - DOI - PMC - PubMed
    1. Berni Canani R, et al. Differences in DNA methylation profile of Th1and Th2 cytokine genes are associated with tolerance acquisition in children with IgE-mediated cow’s milk allergy. Clin Epigenetics. 2015;7:38. doi: 10.1186/s13148-015-0070-8. - DOI - PMC - PubMed

Publication types