. 2019 Feb 26;9(1):2822.
doi: 10.1038/s41598-019-39563-x.

Mieap-induced accumulation of lysosomes within mitochondria (MALM) regulates gastric cancer cell invasion under hypoxia by suppressing reactive oxygen species accumulation

Affiliations

Mieap-induced accumulation of lysosomes within mitochondria (MALM) regulates gastric cancer cell invasion under hypoxia by suppressing reactive oxygen species accumulation

Keiichiro Okuyama et al. Sci Rep. .

Abstract

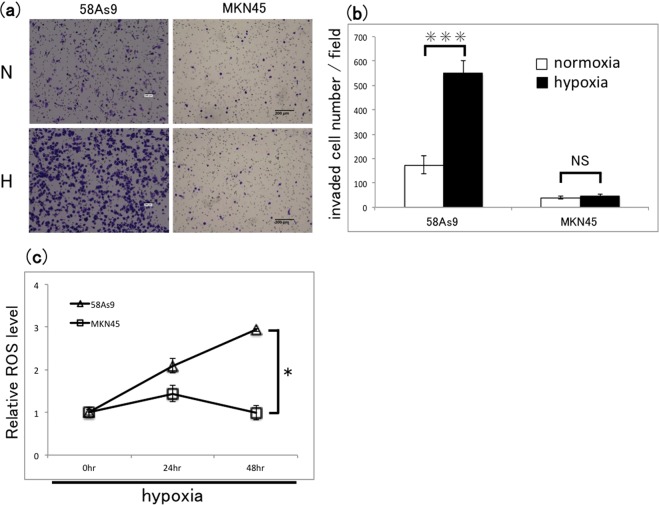
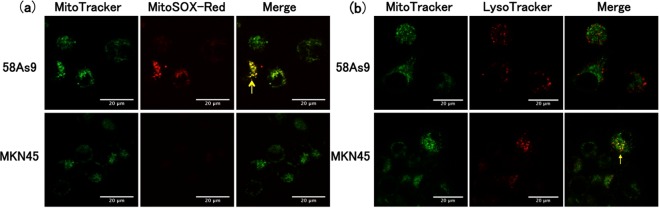
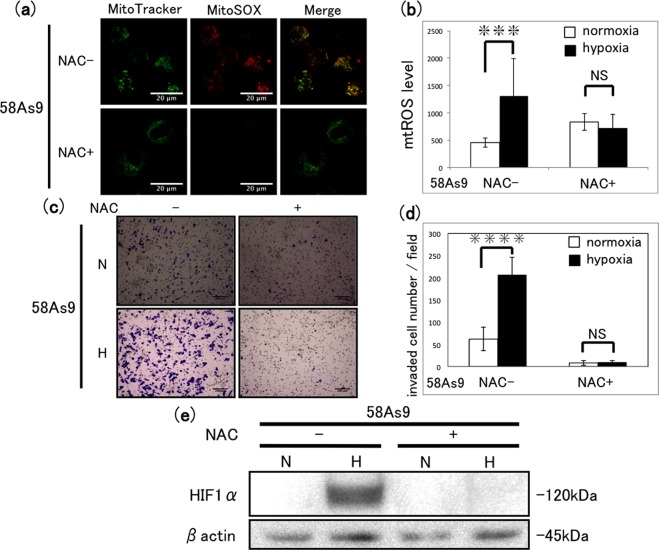
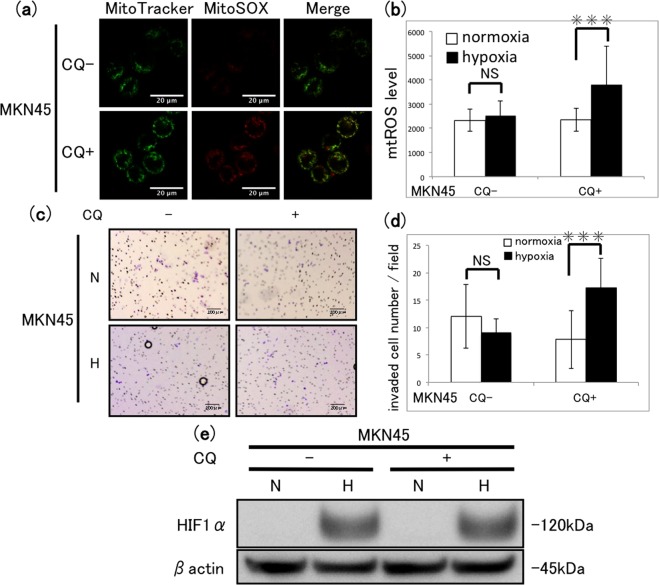
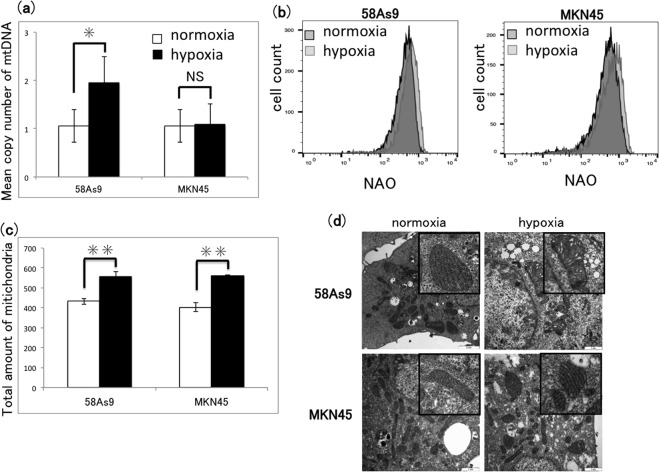
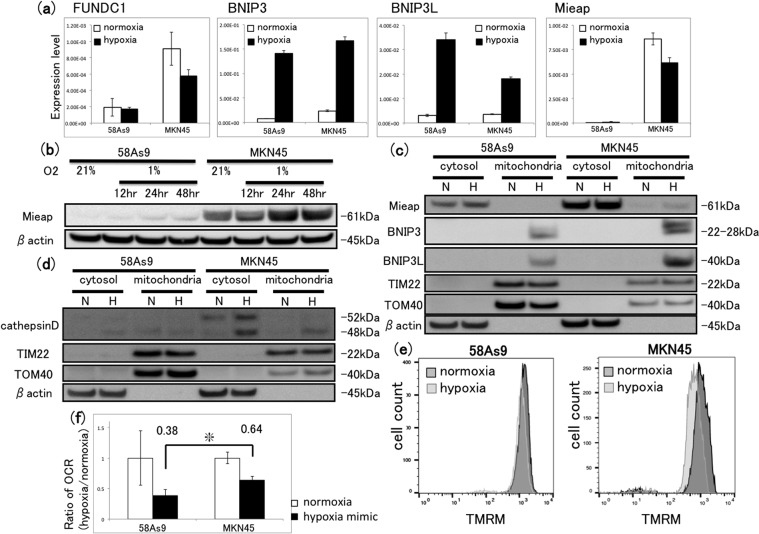
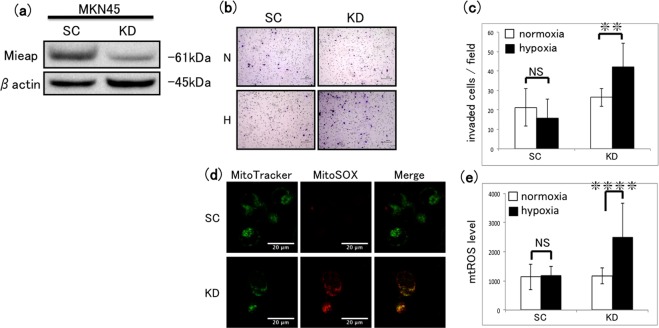
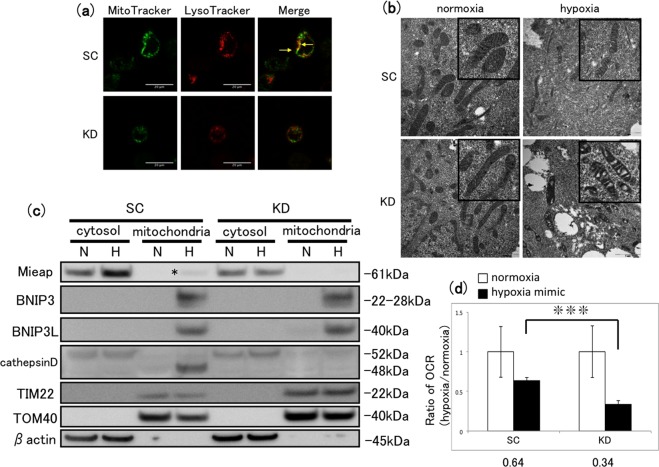
Mitochondrial quality control (MQC) protects against potentially damaging events, such as excessive generation of mitochondrial reactive oxygen species (mtROS). We investigated the contribution of the two major MQC processes, namely, mitophagy and Mieap-induced accumulation of lysosomes within mitochondria (MALM), to the response to hypoxia of two human gastric cancer (GC) cell lines. We found that hypoxia increased mtROS generation and cell invasion in 58As9, but not in MKN45, although the transcription factor hypoxia-inducible factor 1α was induced in both cell lines. Colocalisation of lysosomes with mitochondria was found only in hypoxic MKN45 cells, suggesting that hypoxia-induced MQC functions normally in MKN45 but may be impaired in 58As9. Hypoxia did not lead to decreased mitochondrial mass or DNA or altered appearance of autophagosomes, as judged by electron microscopy, suggesting that mitophagy was not induced in either cell line. However, western blot analysis revealed the presence of the MALM-associated proteins Mieap, BNIP3 and BNIP3L, and the lysosomal protein cathepsin D in the mitochondrial fraction of MKN45 cells under hypoxia. Finally, Mieap knockdown in MKN45 cells resulted in increased mtROS accumulation and cell invasion under hypoxia. Our results suggest that hypoxia-induced MALM suppresses GC cell invasion by preventing mtROS generation.


Conflict of interest statement

The authors declare no competing interests.

Figures

Figure 1
Figure 1
Analysis of hypoxia-induced cell invasion and ROS accumulation in GC cell lines. (a) Transwell invasion assay of 58As9 and MKN45 GC cells after incubation under normoxia (N) or hypoxia (H) for 48 h. Cells were stained with crystal violet. Scale bars, 200 µm. (b) Quantification of invaded cells shown in (a). Mean ± SD of n = 3. ***P < 0.005; NS, not significant. (c) Flow cytometric analysis of total intracellular ROS in 58As9 and MKN45 cells after incubation under normoxia (0 h) and hypoxia for 24 and 48 h. Data are normalised to the levels under normoxia. Mean ± SD of n = 3. *P < 0.05.
Figure 2
Figure 2
mtROS production and MQC status in GC cells. (a) Fluorescence micrographs of 58As9 and MKN45 cells after incubation under hypoxia for 48 h and double staining with MitoTracker and MitoSOX-Red. Colocalisation of fluorescence, reflecting mitochondrial ROS production, is indicated by the arrow in the merged image of 58As9 cells. Scale bars, 20 µm. (b) Fluorescence images of 58As9 and MKN45 cells after incubation under hypoxia for 48 h and double staining with MitoTracker and LysoTracker. Dotted colocalisation of fluorescence, reflecting the presence of mitochondrial lysosomes, is indicated by the arrow in the merged image of MKN45 cells. Scale bars, 20 µm.
Figure 3
Figure 3
Effect of a ROS scavenger on mtROS generation and invasion in 58As9 cells. (a) Fluorescence micrographs of 58As9 cells after incubation with (+) or without (−) 20 mM N-acetyl-l-cysteine (NAC) for 48 h and double staining with MitoTracker and MitoSOX-Red. Scale bars, 20 µm. (b) Quantification of mtROS levels in untreated and NAC-treated cells after incubation under normoxia (N) or hypoxia (H) for 48 h. Mean ± SD of n = 3. NS, not significant; ***P < 0.005. (c) Transwell invasion assay of 58As9 cells after incubation with or without 20 mM NAC under normoxia (N) or hypoxia (H) for 48 h. Scale bars, 200 µm. (d) Quantification of invaded cells shown in (c). Mean ± SD of n = 3. NS, not significant; ****P < 0.001. (e) Western blot analysis of HIF-1α expression after incubation of cells with (+) or without (−) 20 mM NAC under normoxia (N) or hypoxia (H) for 12 h.
Figure 4
Figure 4
Effect of lysosomal inhibition on mtROS generation and invasion of MKN45 cells. (a) Fluorescence micrographs of cells after incubation with (+) or without (−) 10 µM chloroquine (CQ) for 48 h of hypoxia and double staining with MitoTracker and MitoSOX-Red. Scale bars, 20 µm. (b) Quantification of mtROS levels in cells treated with or without 10 µM CQ under normoxia (N) or hypoxia (H) for 48 h. Mean ± SD of n = 3. NS, not significant; ***P < 0.005. (c) Transwell invasion assay of MKN45 cells after incubation with or without 10 µM CQ under normoxia (N) or hypoxia (H) for 48 h. Scale bars, 200 µm. (d) Quantification of invaded cells shown in (c). Mean ± SD of n = 3. NS, not significant; ***P < 0.005. (e) Western blot analysis of HIF-1α expression in cells after incubation with (+) or without (−) 10 µM CQ under normoxia (N) or hypoxia (H) for 12 h. Prior to incubation with primary antibodies, the blotted membrane was stained with Ponceau dye (Supplementary Fig. S3).
Figure 5
Figure 5
Analysis of mitophagy in GC cells under hypoxia or normoxia. (a) 58As9 and MKN45 GC cells were incubated under normoxia or hypoxia for 48 h. Mean copy number of mtDNA was estimated by quantitative PCR analysis and plotted in a graph. Mean ± SD of n = 6. NS, not significant; *P < 0.05. (b) Flow cytometric analysis of mitochondrial mass measured by nonyl acridine orange (NAO) staining of GC cells after incubation under normoxia or hypoxia for 48 h. (c) Quantification of mitochondrial mass shown in (b). Mean ± SD of n = 3. **P < 0.01. (d) Electron microscopic analysis of mitochondrial morphology in GC cells after incubation under normoxia or hypoxia for 48 h. Insets show magnifications of mitochondria. Scale bars, 1 µm.
Figure 6
Figure 6
Assessment of molecular changes associated with mitophagy and MALM in GC cells. (a) RT-qPCR analysis of mitophagy- or MALM-related gene expression in 58As9 and MKN45 cells after incubation under normoxia or hypoxia for 24 h. Mean ± SD of n = 3. (b) Western blot analysis of Mieap in whole-cell lysates of GC cells after incubation under normoxia for 24 h or hypoxia for 12–48 h. Prior to incubation with primary antibodies, the blotted membrane was stained with Ponceau dye (Supplementary Fig. S4). (c) Western blot analysis of Mieap, BNIP3 and BNIP3L proteins in fractionated lysates of GC cells after incubation under normoxia or hypoxia for 48 h. TIM22 and TOM40 are markers for the mitochondrial fraction, and β-actin is a marker for the cytosolic fraction. A nonspecific signal that does not reflect Mieap is present in the cytosolic fraction of 58As9 cells. Prior to incubation with primary antibodies, the blotted membrane was stained with Ponceau dye (Supplementary Fig. S5). (d) Western blot analysis of cathepsin D in fractionated lysates of GC cells after incubation under normoxia or hypoxia for 48 h. Prior to incubation with primary antibodies, the blotted membrane was stained with Ponceau dye (Supplementary Fig. S6). (e) Flow cytometric analysis of the mitochondrial membrane potential integrity assessed by TMRM staining in GC cells after incubation under normoxia or hypoxia for 72 h. (f) Ratio of the oxygen consumption rate (OCR; µs/µg protein) by 58As9 and MKN45 cells after incubation under normoxic or hypoxia-mimicking (CoCl2) conditions for 24 h. Numbers above the bars indicate the mean OCR ratio (OCR under hypoxia/normoxia) for each cell line. Mean ± SD of n = 3. *P < 0.05.
Figure 7
Figure 7
Effect of Mieap knockdown in MKN45 cells on cell invasion and mtROS generation. (a) Western blot analysis of Mieap expression in MKN45 cells stably expressing scrambled shRNA (SC) or Mieap-specific shRNA (KD) under normoxic conditions. Prior to incubation with primary antibodies, the blotted membrane was stained with Ponceau dye (Supplementary Fig. S7). (b) Transwell invasion assay of SC and Mieap KD MKN45 cells after incubation under normoxia (N) or hypoxia (H) for 48 h. Scale bars 200 µm. (c) Quantification of invaded cells shown in (b). Mean ± SD of n = 3. NS, not significant; **P < 0.01. (d) Fluorescence images of SC and KD cells after incubation under normoxia or hypoxia for 48 h and double staining with MitoTracker and MitoSOX-Red. Scale bars 20 µm. (e) Quantification of mtROS levels in SC and KD cells after incubation under normoxia or hypoxia for 48 h. Mean ± SD of n = 3. NS, not significant; ****P < 0.001.
Figure 8
Figure 8
Assessment of MALM status in Mieap KD MKN45 cells. (a) Fluorescence images of SC or Mieap KD cells after incubation under hypoxia for 48 h and double staining with MitoTracker and LysoTracker. Arrows in the merged image indicate colocalised lysosomes and mitochondria. Scale bars, 20 µm. (b) Electron microscopic analysis of SC and Mieap KD cells after incubation under normoxia or hypoxia for 48 h. Insets show magnifications of mitochondria. Scale bars, 1 µm. (c) Western blot analysis of Mieap, BNIP3, BNIP3L and cathepsin D in fractionated lysates from SC and Mieap KD cells after incubation under normoxia or hypoxia for 24 h. Asterisk indicates a weak Mieap band in the mitochondrial fraction of hypoxic SC cells. Prior to incubation with primary antibodies, the blotted membrane was stained with Ponceau dye (Supplementary Fig. S8). (d) Ratio of OCR (µs/µg protein) of SC and Mieap KD cells after incubation under normoxic or hypoxia-mimicking (CoCl2) conditions for 24 h. Mean ± SD or n = 3. Numbers below the graph indicate the mean OCR ratios (OCR under hypoxia/normoxia) for each cell line. ***P < 0.005.

References

    1. Prasad S, Gupta SC, Tyagi AK. Reactive oxygen species (ROS) and cancer: Role of antioxidantive nutraceuticals. Cancer Lett. 2017;387:95–105. doi: 10.1016/j.canlet.2016.03.042. - DOI - PubMed
    1. Ray PD, et al. Reactive oxygen species (ROS) homeostasis and redox regulation in cellular signaling. Cell Signal. 2012;24:981–990. doi: 10.1016/j.cellsig.2012.01.008. - DOI - PMC - PubMed
    1. Guzy RD, et al. Mitochondrial complex III is required for hypoxia-induced ROS production and cellular oxygen sensing. Cell Metab. 2005;1:401–408. doi: 10.1016/j.cmet.2005.05.001. - DOI - PubMed
    1. Chandel NS, et al. Reactive oxygen species generated at mitochondrial complex III stabilize hypoxia-inducible factor-1a during hypoxia. J Biol Chem. 2000;275:25130–25138. doi: 10.1074/jbc.M001914200. - DOI - PubMed
    1. Georgieva E, et al. Mitochondrial dysfunction and redox imbalance as a diagnostic marker of “Free Radical Diseases”. ANTICANCER RES. 2017;37:5375–5381. - PubMed

Publication types