Review
. 2019 Feb 12:10:76.
doi: 10.3389/fneur.2019.00076. eCollection 2019.

Chromatic Pupillometry Methods for Assessing Photoreceptor Health in Retinal and Optic Nerve Diseases

Affiliations
Review

Chromatic Pupillometry Methods for Assessing Photoreceptor Health in Retinal and Optic Nerve Diseases

A V Rukmini et al. Front Neurol. .

Abstract

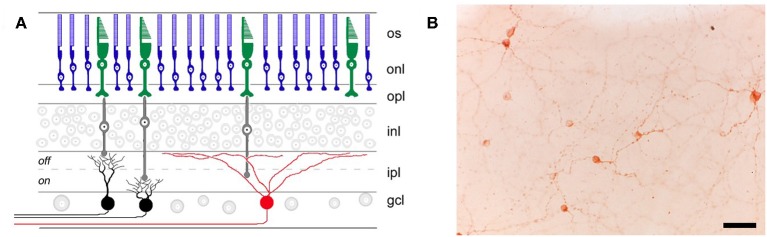
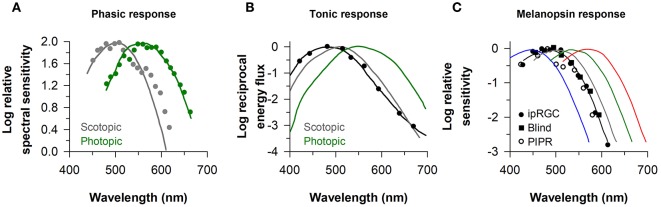
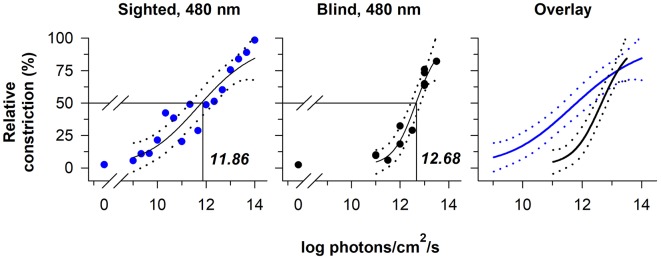
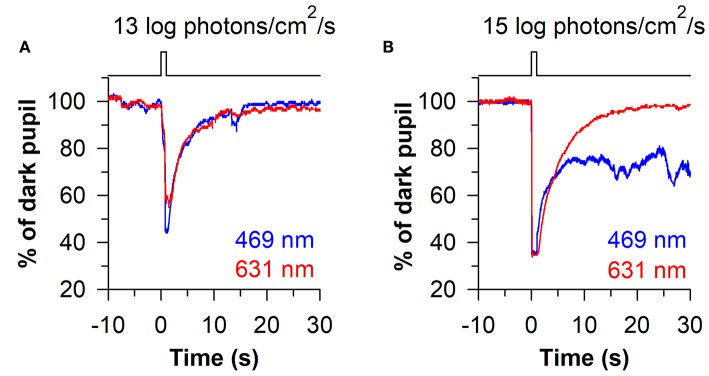
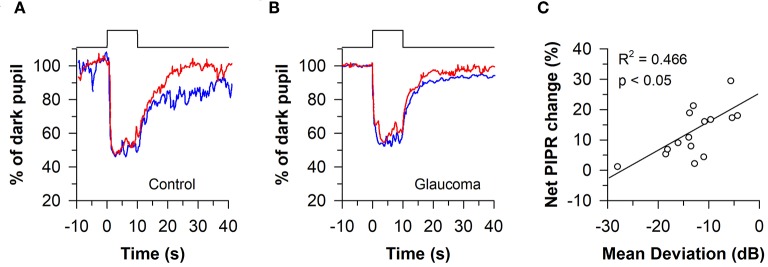
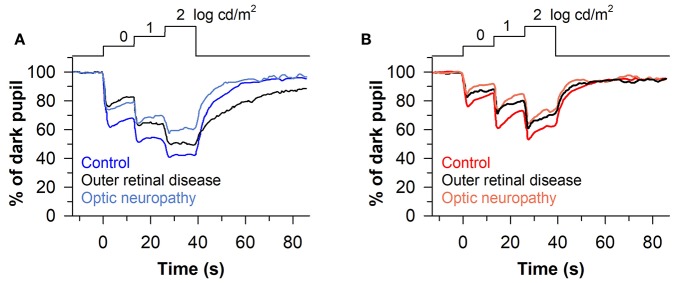
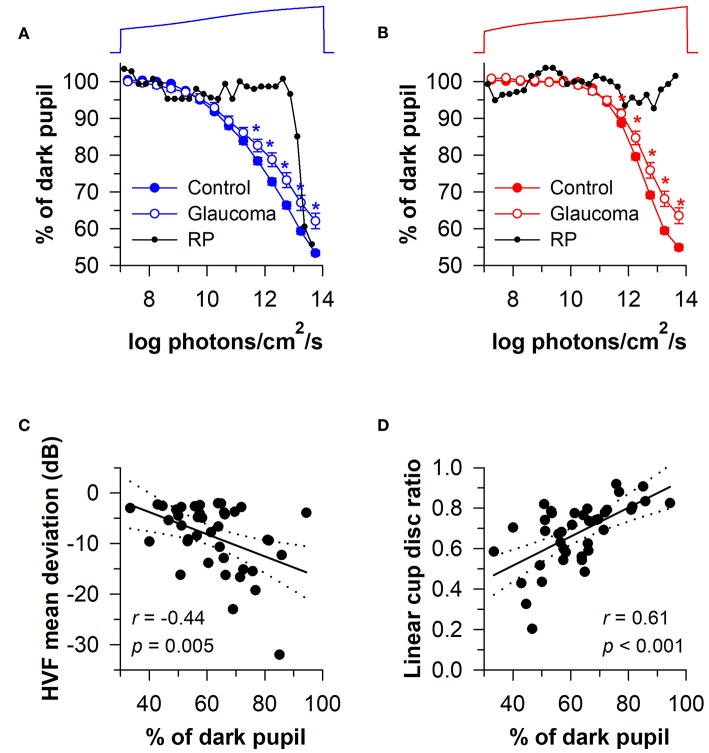
The pupillary light reflex is mediated by melanopsin-containing intrinsically-photosensitive retinal ganglion cells (ipRGCs), which also receive input from rods and cones. Melanopsin-dependent pupillary light responses are short-wavelength sensitive, have a higher threshold of activation, and are much slower to activate and de-activate compared with rod/cone-mediated responses. Given that rod/cone photoreceptors and melanopsin differ in their response properties, light stimuli can be designed to stimulate preferentially each of the different photoreceptor types, providing a read-out of their function. This has given rise to chromatic pupillometry methods that aim to assess the health of outer retinal photoreceptors and ipRGCs by measuring pupillary responses to blue or red light stimuli. Here, we review different types of chromatic pupillometry protocols that have been tested in patients with retinal or optic nerve disease, including approaches that use short-duration light exposures or continuous exposure to light. Across different protocols, patients with outer retinal disease (e.g., retinitis pigmentosa or Leber congenital amaurosis) show reduced or absent pupillary responses to dim blue-light stimuli used to assess rod function, and reduced responses to moderately-bright red-light stimuli used to assess cone function. By comparison, patients with optic nerve disease (e.g., glaucoma or ischemic optic neuropathy, but not mitochondrial disease) show impaired pupillary responses during continuous exposure to bright blue-light stimuli, and a reduced post-illumination pupillary response after light offset, used to assess melanopsin function. These proof-of-concept studies demonstrate that chromatic pupillometry methods can be used to assess damage to rod/cone photoreceptors and ipRGCs. In future studies, it will be important to determine whether chromatic pupillometry methods can be used for screening and early detection of retinal and optic nerve diseases. Such methods may also prove useful for objectively evaluating the degree of recovery to ipRGC function in blind patients who undergo gene therapy or other treatments to restore vision.

Keywords: blind; blue light; glaucoma; melanopsin; optic nerve; pupillary light reflex; pupillometry; retina.


Figures

Figure 1
Figure 1
Retinal location of different photoreceptor types. (A) Rods (blue) and cones (green) in the outer retina transmit light information via bipolar cells (gray) to retinal ganglion cells (RGCs) in the inner retina. RGCs that are involved in image-forming vision are not directly photosensitive (black), whereas RGCs involved in non-visual light responses (e.g., the pupillary light reflex) contain the photopigment melanopsin (red) and are intrinsically photosensitive. os, outer segments; onl, outer nuclear layer; opl, outer plexiform layer; inl, inner nuclear layer; ipl, inner plexiform layer; gcl, ganglion cell layer. (B) Melanopsin-containing RGCs (labeled immunohistochemically in brown) are distributed broadly and in small numbers across the retina, as shown in a flat-mount preparation of a rat retina (scale bar = 50 μm). Panel (A) was reproduced with permission from Berson (36). Panel (B) is a photomicrograph provided by the corresponding author, JG (Clifford Saper Laboratory, Beth Israel Deaconess Medical Center, Boston, MA).
Figure 2
Figure 2
Spectral responses of the pupillary light reflex. (A) The spectral sensitivity for pupillary responses to flashes of dim light (gray circles) and bright light on a rod-suppressing blue background (green circles) are shown for representative subjects. Spectral responses for the phasic pupillary light reflex closely resemble scotopic and photopic luminosity functions (gray and green lines, respectively). (B) The spectral sensitivity for the tonic pupillary light reflex during continuous exposure to light (black circles) is short-wavelength shifted (peak constriction, ≈ 490 nm) relative to scotopic and photopic luminosity functions (gray and green lines, respectively). (C) The spectral sensitivity of melanopsin-dependent responses (peak constriction, ≈ 480 nm) is shown for intrinsically-photosensitive retinal ganglion cells in macaques (ipRGCs, black circles), the pupillary light reflex in a blind individual with no light perception (Blind, black squares), and the sustained post-illumination pupillary light response in individuals with normal vision (PIPR, open circles). The spectral sensitivity of rod and cone photoreceptors is shown for comparison (rods, gray; S-cones, blue; M-cones, green; L-cones, red). Panel (A) is redrawn and modified with permission from (2); Panel (B) was redrawn and modified with permission from (46); Panel (C) was redrawn and modified with permission from (23), with data superimposed from (37) and (47).
Figure 3
Figure 3
The contribution of rod-cone photoreceptors and melanopsin to pupillary light responses is irradiance-dependent. Irradiance-response curves for the pupillary light reflex are shown for a continuously presented blue-light stimulus (480 nm; pupil measured from 90 to 120 s after light onset) in individuals with normal vision (blue circles, left panel) and in a blind individual with no light perception (black circles, middle panel). An overlay of the irradiance-response curves (right panel) shows reduced pupillary responses to lower-irradiance exposures in the blind individual, whereas the melanopsin-dependent response at the highest irradiances tested was comparable to sighted individuals. In each plot, the best-fit regression line is shown with 95% CIs (solid and dotted lines, respectively). Drop lines indicate the irradiance corresponding to a half-maximal pupillary constriction response. Data are replotted with permission from (38).
Figure 4
Figure 4
Phasic and sustained pupillary responses to 1-s flashes of blue or red light. (A) Pupillary responses are shown for a representative individual exposed to a moderately-bright 1-s flash of either blue light or red light (469 or 631 nm; 13 log photons/cm2/s). The pupil showed a transient high-amplitude constriction response after light onset, with fast re-dilation of the pupil after light offset. (B) In response to a high-intensity 1-s flash of light (15 log photons/cm2/s), the transient pupillary constriction response was followed by a prolonged post-illumination pupillary light response (PIPR) to the blue light stimulus, but not the red light stimulus. The sustained PIPR is thought to be driven by slow-deactivation of melanopsin after light offset. The figure is replotted with permission from (58).
Figure 5
Figure 5
Melanopsin-dependent pupillary responses are slower than rod/cone-dependent responses. (A) Representative pupillary light responses are shown for a sighted individual and a blind individual without rod and cone function. The pupil in the blind individual responded slowly after light onset and light offset, indicating that outer retinal photoreceptors are necessary for the phasic component of the pupillary light reflex. (B) In sighted individuals, the pupil could track an intermittent light stimulus (480 nm, 13 log photons/cm2/s) with alternating periods of light and darkness (5 s of light, 5 s of darkness). By comparison, the pupil in the blind individual was unable to track the intermittent stimulus. Rather, the melanopsin-dependent pupillary response increased across several light pulses until reaching a steady response. Data are replotted with permission from (38).
Figure 6
Figure 6
Protocol for assessing photoreceptor health using 1-s light flashes. Pupillary responses were assessed in patients with Leber congenital amaurosis (LCA), using light stimuli designed to stimulate preferentially rods, cones, or melanopsin. (A) Pupillary responses to the rod-weighted light stimulus (465 nm, −3 log cd/m2 after 10 min of dark adaptation) were non-recordable in LCA patients. (B) Responses to the cone-weighted light stimulus (642 nm, 1 log cd/m2 on a blue background of 0.78 log cd/m2) were reduced in LCA patients compared with healthy controls. (C) The post-illumination pupillary response to the melanopsin-weighted stimulus (2.6 log cd/m2) was intact in LCA patients but the amplitude was reduced. Gray traces show the range of pupillary responses in the control group. The figure is redrawn and modified with permission from (67).
Figure 7
Figure 7
Protocol for assessing melanopsin-dependent pupillary responses using the post-illumination pupillary light response (PIPR). The PIPR was assessed after exposure to 10 s of bright blue light or red light (488 or 610 nm; 14.2 log quanta/cm2/s). (A) In individuals with normal vision, the PIPR to blue light was greater than the PIPR to red light for at least 30 s after light offset. (B) In patients with glaucoma, the PIPR to blue light was reduced relative to red light, indicating reduced light transmission from melanopsin-containing retinal ganglion cells. (C) In glaucomatous eyes, the net PIPR change (the difference in the PIPR to blue light vs. red light, adjusted for baseline pupil size) correlated with visual field loss assessed by Humphrey visual field mean deviation. Panels (A,B) are redrawn with permission from (87). Panel (C) is redrawn with permission from (86).
Figure 8
Figure 8
Protocol for assessing photoreceptor health using stepwise increases in light intensity. Pupillary responses were assessed in patients with outer retinal disease or optic nerve disease, using blue and red light stimuli that were presented for 13 s in each step (467 or 640 nm; 0, 1, and 2 log cd/m2). (A) Patients with outer retinal disease or optic nerve disease showed reduced pupillary light responses to each stepwise increase in blue light. However, the post-illumination pupillary light response after the last light step was prolonged only in patients with outer retinal disease. (B) Both groups of patients showed impaired pupillary responses to each stepwise increase in red light compared with controls, but there was no difference between groups in the PIPR. The figure is redrawn and modified with permission from (63).
Figure 9
Figure 9
Protocol for assessing photoreceptor health using a ramp-up light exposure. Pupillary responses to blue light or red light were assessed during exposure to a continuously presented light stimulus that was increased gradually over a 2-min period (469 or 631 nm; from 7 to 14 log photons/cm2/s). (A) Pupillary responses to blue light were reduced in patients with glaucoma at higher irradiances compared with controls. In contrast, pupillary responses were reduced at dim-to-moderate light intensities in a patient with retinitis pigmentosa (RP) without rod/cone function, but were normal at the highest irradiances tested. (B) Pupillary responses to red light were also reduced in patients with glaucoma at higher irradiances, whereas there was no detectable response in the RP patient. In glaucomatous eyes, the magnitude of pupillary constriction during exposure to high-irradiance blue light (>13.5 log photons/cm2/s) correlated with (C) visual field loss determined by Humphrey Visual Field (HVF) mean deviation, and (D) optic disc cupping determined by Heidelberg Retinal Tomography. In (C,D), the linear regression line is shown with 95% CIs. Data for glaucoma patients are replotted and modified with permission from (58). Data for the RP patient are replotted and modified with permission from (94).

Similar articles

Cited by

References

    1. Bremner FD. Pupil assessment in optic nerve disorders. Eye (2004) 18:1175–81. 10.1038/sj.eye.6701560 - DOI - PubMed
    1. Alpern M, Campbell FW. The spectral sensitivity of the consensual light reflex. J Physiol. (1962) 164:478–507. - PMC - PubMed
    1. Laurens H. Studies on the relative physiologial value of spectral lights. Am J Physiol Legacy Content (1923) 64:97–119. 10.1152/ajplegacy.1923.64.1.97 - DOI
    1. Wagman IH, Gullberg JE. The relationship between monochromatic light and pupil diameter. The low intensity visibility curve as measured by pupillary measurements. Am J Physiol Legacy Content (1942) 137:769–78. 10.1152/ajplegacy.1942.137.4.769 - DOI
    1. Schweitzer NJ, Bouman MA. Differential threshold measurements on the light reflex of the human pupil. AMA Arch Ophthalmol. (1958) 59:541–50. 10.1001/archopht.1958.00940050097012 - DOI - PubMed

LinkOut - more resources