. 2019 Feb 12:10:136.
doi: 10.3389/fmicb.2019.00136. eCollection 2019.

Transcriptional Shifts Highlight the Role of Nutrients in Harmful Brown Tide Dynamics

Affiliations

Transcriptional Shifts Highlight the Role of Nutrients in Harmful Brown Tide Dynamics

Louie L Wurch et al. Front Microbiol. .

Abstract

Harmful algal blooms (HABs) threaten ecosystems and human health worldwide. Controlling nitrogen inputs to coastal waters is a common HAB management strategy, as nutrient concentrations often suggest coastal blooms are nitrogen-limited. However, defining best nutrient management practices is a long-standing challenge: in part, because of difficulties in directly tracking the nutritional physiology of harmful species in mixed communities. Using metatranscriptome sequencing and incubation experiments, we addressed this challenge by assaying the in situ physiological ecology of the ecosystem destructive alga, Aureococcus anophagefferens. Here we show that gene markers of phosphorus deficiency were expressed in situ, and modulated by the enrichment of phosphorus, which was consistent with the observed growth rate responses. These data demonstrate the importance of phosphorus in controlling brown-tide dynamics, suggesting that phosphorus, in addition to nitrogen, should be evaluated in the management and mitigation of these blooms. Given that nutrient concentrations alone were suggestive of a nitrogen-limited ecosystem, this study underscores the value of directly assaying harmful algae in situ for the development of management strategies.

Keywords: Aureococcus anophagefferens; brown tide; harmful algal bloom; metatranscriptomics; nutrient physiology.


Figures

FIGURE 1
FIGURE 1
Map of study site in Quantuck Bay, NY where a severe brown tide occurred in 2011 (A) A. anophagefferens cell densities (red) over the course of the bloom (B) The surface water DIN:DIP ratio is indicated (blue) with the Redfield ratio (dashed line) indicated at 16. Arrows represent points in the bloom where metatranscriptome analyses were performed. Samples (S) S1 and S2 represent peak bloom conditions whereas S3 represents bloom decline. On June 22nd, a nutrient amendment (N, nitrogen; P, phosphorus) experiment was conducted and samples were taken after 24 h for metatranscriptome analysis. The growth rates of A. anophagefferens are shown in the embedded graph for this nutrient amendment experiment.
FIGURE 2
FIGURE 2
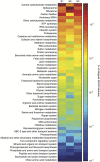
Aureococcus anophagefferens transcriptional changes across in situ samples (S1–S3). Colors indicate the relative expression of different KEGG functional classes (e.g., central carbohydrate metabolism) calculated by normalizing the library-normalized reads to the total number of KEGG annotated reads in a sample.
FIGURE 3
FIGURE 3
Gene expression values in tags per million (TPM) in the nitrogen (N) addition (left) (A), phosphorus (P) addition (middle) (B), and N&P addition (right) (C) experiments relative to a no nutrient added control. The nutrient amendment experiment was started during bloom decline at S3 as noted in Figure 1. Significance was determined with ASC (fold change > 2, post-p > 0.95). Red indicates genes with significantly increased expression and green indicates genes with significantly decreased expression in the nutrient addition treatments versus the control. Note the log scale of the axes.
FIGURE 4
FIGURE 4
Expression patterns in tags per million (TPM) at peak bloom (S1 and S2) and bloom decline (S3) of select nutrient-responsive genes detected in the incubation experiments. The TPM of the urea transporter (A), phosphate transporter (PTA3) (B), 5′-nucleotidase (C), and arsenite-translocating ATPase Arsenite transporter (D) highlighted in Figure 3 are plotted. Significance was determined with ASC (fold change > 2, post-p > 0.99). Red and yellow indicates that the transcript was significantly more abundant while green and blue indicate significantly less abundant (none shown here), with a fold change greater than or equal to 2 relative to a nutrient replete culture control of A. anophagefferens (dashed line). NS indicates the transcript was not significantly different.

References

    1. Alexander H. A., Jenkins B. D., Rynearson T. A., Dyhrman S. T. (2015). Metatranscriptome analyses indicate resource partitioning between diatoms in the field. Proc. Natl. Acad. Sci. U.S.A. 112 E2182–E2190. 10.1073/pnas.1421993112 - DOI - PMC - PubMed
    1. Anderson D. M., Burkholder J. M., Cochlan W. P., Glibert P. M., Gobler C. J., Heil C. A., et al. (2008). Harmful algal blooms and eutrophication: examining linkages from selected coastal regions of the United States. Harmful Algae 8 39–53. 10.1016/j.hal.2008.08.017 - DOI - PMC - PubMed
    1. Anderson D. M., Cembella A. D., Hallegraeff G. M. (2012). Progress in understanding harmful algal blooms: paradigm shifts and new technologies for research, monitoring and management. Annu. Rev. Mar. Sci. 4 143–176. 10.1146/annurev-marine-120308-081121 - DOI - PMC - PubMed
    1. Anderson D. M., Glibert P. M., Burkholder J. M. (2002). Harmful algal blooms and eutrophication: nutrient sources, composition, and consequences. Estuaries 25 704–726. 10.1007/BF02804901 - DOI
    1. Berg G. M., Repeta D. J., Laroche J. (2002). Dissolved organic nitrogen hydrolysis rates in axenic cultures of Aureococcus anophagefferens (Pelagophyceae): comparison with heterotrophic bacteria. Appl. Environ. Microbiol. 68 401–404. 10.1128/AEM.68.1.401-404.2002 - DOI - PMC - PubMed

LinkOut - more resources