. 2019 Feb 12:10:222.
doi: 10.3389/fimmu.2019.00222. eCollection 2019.

Expression of the Phosphatase Ppef2 Controls Survival and Function of CD8+ Dendritic Cells

Affiliations

Expression of the Phosphatase Ppef2 Controls Survival and Function of CD8+ Dendritic Cells

Markus Zwick et al. Front Immunol. .

Abstract

Apoptotic cell death of Dendritic cells (DCs) is critical for immune homeostasis. Although intrinsic mechanisms controlling DC death have not been fully characterized up to now, experimentally enforced inhibition of DC-death causes various autoimmune diseases in model systems. We have generated mice deficient for Protein Phosphatase with EF-Hands 2 (Ppef2), which is selectively expressed in CD8+ DCs, but not in other related DC subtypes such as tissue CD103+ DCs. Ppef2 is down-regulated rapidly upon maturation of DCs by toll-like receptor stimuli, but not upon triggering of CD40. Ppef2-deficient CD8+ DCs accumulate the pro-apoptotic Bcl-2-like protein 11 (Bim) and show increased apoptosis and reduced competitve repopulation capacities. Furthermore, Ppef2-/- CD8+ DCs have strongly diminished antigen presentation capacities in vivo, as CD8+ T cells primed by Ppef2-/- CD8+ DCs undergo reduced expansion. In conclusion, our data suggests that Ppef2 is crucial to support survival of immature CD8+ DCs, while Ppef2 down-regulation during DC-maturation limits T cell responses.

Keywords: CD8 T cell priming; DC-maturation; apoptosis; cross-presentation; dendritic cells; immune homeostasis.


Figures

Figure 1
Figure 1
Ppef2 is predominantly expressed by CD8+ cDC1. (A) Gene expression profiling of spleen and blood cells after sorting. Shown is the quantitative real-time PCR result for Ppef2 of three independent sort experiments (n = 3 pooled mice per sort) ± SEM analyzed by the ΔCt method with HPRT as housekeeping gene. Cells were identified and sorted as ESAMhi (CD11c+MHCII+CD11b+ESAMhi); ESAMlo (CD11c+MHCII+CD11b+ESAMlo); CD8+DC (CD11c+MHCII+CD11bCD8+); pDC (CD11bSiglecH+); CD4+ T cells (CD3+CD4+); CD8+ T cells (CD3+CD8+); B cells (CD19+B220+); blood monocytes NK1.1B200CD115+CD11b+Ly6G cells with differential Ly6C and MHCII expression as indicated. Gating strategies are shown in Supplemental Figure 1B. (B) Ppef2 expression in GM-CSF cultured BMDCs of C57BL/6 mice after cell sorting on day 7 of culture based on the expression of CD11c, MHCII, and CD86. Error bars represent SEM of 3 independent experiments. (C) Ppef2 expression 16h after in vitro stimulation with the indicated TLR-ligands of GM-CSF- or Flt3L-cultured BMDCs of C57BL/6 mice, as well as spleen CD8+ DCs 16h after intravenous injection of 10 μg LPS as determined by qPCR. Bar graphs with SEM represent pooled data from independently performed cell cultures [GM-CSF BMDCs: unstim., LPS (n = 5); Flagellin, Poly(I:C), Pam3CSK4, CLO97, (n = 4); anti-CD40, LPS+anti-CD40 (n = 3); Flt3L BMDCs (n = 3); sorted CD8+ DCs (n = 4)]. Statistical analysis was performed using Student's t-test, with *p < 0.05; **p < 0.01; ***p < 0.001.
Figure 2
Figure 2
Ppef2-knockout strategy and LacZ-Reporter. (A) The Ppef2 locus with the knockout-first construct containing the gene trap between exon 4 and 5, as well as the floxed exon 5. (B) Ppef2 expression analysis of CD11c enriched splenocytes in Ppef2+/+ and Ppef2−/− mice by quantitative real-time PCR. Three sets of intron-spanning primer pairs were used to amplify fragments from exons 2 to 3, 4 to 5, and 11 to 12. The ΔCt method was used to calculate the fold expression compared to Ppef2+/+ control samples. Data was normalized to HPRT (n = 3 mice). (C) Genomic distribution of reads across the Ppef2 gene locus in Ppef2+/+ and Ppef2−/− CD8+ DCs. (D) Measurement of ß-Gal activity by flow cytometry in different cell types of the spleen, lymph node, thymus and bone marrow. Shown are representative FACS-plots of three experiments with similar outcome. (E) The mean fluorescence intensity (MFI) was calculated from one representative experiment out of two with identical outcome (n = 4). (F) Flow cytometric measurement of ß-Gal activity in splenic CD8+ DCs. Ppef2lacZ/lacZ reporter mice (red, uninjected) were injected intravenously with LPS either 4 h (blue) or 12 h (black) before analysis. Shown are FACS-plots and statistics, where the ß-Gal signal of reporter mice was subtracted from the ß-Gal background signal of control mice (n = 18 mice). Statistical analyses were performed by using Student's t-test, with *p < 0.05; **p < 0.01; ***p < 0.001.
Figure 3
Figure 3
Ppef2−/− -mice have normal frequencies of DCs and DC-precursors. (A) DCs of spleen, LN and thymus were stained with CD11c and MHCII. Shown are representative FACS plots with the average DC percentages ± SEM of pooled data (spleen, 8 experiments (n = 36); sLN, 4 experiments (n = 23); thymus, 2 experiments (n = 6) as well as the corresponding total cell numbers. (B) The frequency of DC precursors from spleen (n = 3) and bone marrow (n = 4). Shown is one representative experiment out of two with similar outcome. Statistical analysis of (A, B) was performed using Student's t-test and all p-values were above 0.05. (C) Acetone fixed spleen sections of Ppef2+/+ and Ppef2−/− mice were stained with antibodies against CD11c (red), CD8 (green), CD169 (white), and B220 (blue). Scale bars represent 100 μm.
Figure 4
Figure 4
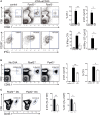
Ppef2-deficiency causes increased levels of cleaved caspase-3 in DCs. (A) Splenocytes were stained intracellularly for cleaved caspase-3 and analyzed by flow cytometry. Shown are representative FACS-plots of two experiments with similar outcome (n = 4 each). The corresponding statistics of the pooled data (n = 8) are shown in (B) together with the statistical analysis of other cell types. Statistical analysis was performed using Student's t-test, with *p < 0.05; **p < 0.01; ***p < 0.001. (C) Mixed bone marrow chimeras were produced by irradiation of CD45.1+ recipients and reconstitution with a 1:1 mix of Ppef2+/+ (CD45.1+) and Ppef2+/+ (CD45.2+) bone marrow (+/+: +/+ > +/+), or a 1:1 mix of Ppef2+/+ (CD45.1+) and Ppef2−/− (CD45.2+) bone marrow (+/+: –/– > +/+). Mixed bone marrow chimeras were analyzed 8–10 weeks after reconstitution by gating on CD11c+MHCII+CD8+CD11b cDC1, CD11c+MHCII+CD8CD11b+ cDC2, CD4+TCRβ+ T cells and CD45.1. Shown are representative FACS-plots of three independently performed experiments with similar outcome (n = 11) and statistical analysis was performed using Student's t-test, with **p < 0.01.
Figure 5
Figure 5
RNA-sequencing reveals changes in RNA-expression of Ppef2−/− CD8+ cDC1. (A) CD8+ DCs were purified by flow cytometry from cell suspensions of 3 pooled spleens as live MHCII+CD11c+CD11bCD8+ cells to purity of >95%. 15 spleens from Ppef2+/+ or Ppef2−/− mice were used to generate 5 samples each for RNA-sequencing. Shown is the volcano plot analysis of sorted CD8+ DCs. Fold change of−2 (a, blue) and +2 (a, red), and a p-value ≤ 0.01 were chosen as cut-off. Ppef2, protein phosphatase EF-hands 2; LOC100503496, uncharacterized transcript LOC100503496; Xlr4c, X-linked lymphocyte-regulated 4C; Dll4, delta-like ligand 4; Trim2, tripartite motif-containing 2; Npcd, neuronal pentraxin chromo domain; Mfsd2b, major facilitator superfamily domain containing 2B; Cmah, cytidine monophospho-N-acetylneuraminic acid hydroxylase; Xntrpc, Xndc1-transient receptor potential cation channel, subfamily C, member 2; A530064D06Rik, Riken cDNA A530064D06 gene; 1810014B01Rik, Riten cDNA 1810014B01 gene; Triqk, triple QxxK/R motif containing; Nptxr, neuronal pentraxin receptor; Rasd1, RAS, dexamethasone-induced 1; Gfra2, glial cell line derived neurotrophic factor family receptor alpha 2; Rmi2, RMI2, RecQ mediated genome instability 2; Thsd1, thrombospondin, type I, domain 1; Ccl2, chemokine (C-C motif) ligand 2; Zfp772, zinc finger protein 772; Cenpw, centromere protein W. (B) Boxplots represent normalized expression with 0,1 quantile, 0.9 quantile and all single points (each group n = 5) **p < 0.01, ***p < 0.001 for Trim2 and Dll4 in Ppef2+/+ and Ppef2−/− cells. (C) qPCR of Trim2 and Dll4 in sorted spleen CD8+ DCs. Spleen DCs were sorted as CD11c+MHCII+CD8+CD11b in three independent experiments and three Ppef2+/+ or Ppef2−/− mice were pooled for every sort. Statistical analysis was performed using Student's t-test, with *p < 0.05; ***p < 0.001.
Figure 6
Figure 6
Ppef2−/− DCs have elevated levels of pro-apoptotic BIM. (A) Western blot for Bim was performed with 30 μg cell lysates of GM-CSF BMDCs either unstimulated or LPS matured. Exposure for 30 s allowed detection of BimEL and BimL isoforms (A left, top panel); 5 min exposure revealed the BimS isoform in addition (A left, middle panel). Intensities of the bands for all three Bim isoforms were quantified relative to the GAPDH loading control (A left, lower panel) by using ImageJ and fold increase was calculated relative to the untreated Ppef2+/+ control (A, right hand panel). Two western blots were performed and shown are pooled normalized intensities. (B) Surface staining of Dll4 was performed with fluorescently labeled antibody and protein abundance was measured by flow cytometry. Shown are representative FACS plots (left) and mean ± SEM of the mean fluorescence intensity of n = 3 mice.
Figure 7
Figure 7
Ppef2−/− DCs display decreased CD8+ T cell priming capacities. (A) 5 × 10⁵ congenitally marked CD90.1+ OT-I T cells were adoptively transferred either in Ppef2+/+ or Ppef2−/− mice, which received 30 μg OVA protein and 100 μg CD40-specific mAb intravenously 1 day later or received OT-I T cells only (control). On day 7 post immunization spleens were analyzed for frequencies and total cell numbers of CD90.1+CD8+ OT-I cells as shown in the respective bar graphs (upper panel). Spleen cells were cultured in vitro with OVA257 peptide in the presence of CD107a-specific mAb and subsequently stained for CD8 and IFN-γ (lower panel) to determine IFN-γ-producing OT-I T cell frequencies and total cell numbers (bar graphs). Shown are results from one experiment out of two with similar results and n = 4 mice per group. (B) 5 × 10⁵ congenitally marked (CD90.1) OT-I T cells were adoptively transferred either in Ppef2+/+ or Ppef2−/− mice, which received 100 μg OVA protein intravenously 1 day later. Mice were sacrificed 3 days after OVA administration and spleens were analyzed by flow cytometry for OT-I T cell proliferation. Shown are representative FACS-plots of OT-I T cells of one out of two independently performed experiments with similar outcome. Data from two independent experiments were pooled (n = 6) to determine the total cell number and frequencies of CD90.1+CD8+ OT-I T cells. (C) 1.5 × 10⁵ Ppef2+/+ or Ppef2−/− DCs were pulsed with OVA257 peptide and transferred i.v. into H-2Kbm1 recipient mice. 24 h later H-2Kbm1 OT-I T cells were transferred and mice were analyzed 3 days later for presence of CD45.1+CD8+ OT-I T cells by flow cytometry. Shown are representative FACS-plots of the gated CD45.1+CD8+ OT-I T cells. Two independently performed experiments were pooled (n = 6) to determine the relative frequency and total cell number of CD45.1+CD8+ OT-I T cells from the gates shown in (C). Statistical analysis was performed using Student's t-test, with *p < 0.05; **p < 0.01.

Similar articles

Cited by

References

    1. Liu K, Victora GD, Schwickert TA, Guermonprez P, Meredith MM, Yao K, et al. . In vivo analysis of dendritic cell development and homeostasis. Science (2009) 324:392–7. 10.1126/science.1170540 - DOI - PMC - PubMed
    1. Merad M, Sathe P, Helft J, Miller J, Mortha A. The dendritic cell lineage: ontogeny and function of dendritic cells and their subsets in the steady state and the inflamed setting. Ann Rev Immunol. (2013) 31:563–604. 10.1146/annurev-immunol-020711-074950 - DOI - PMC - PubMed
    1. Guilliams M, Ginhoux F, Jakubzick C, Naik SH, Onai N, Schraml BU, et al. . Dendritic cells, monocytes and macrophages: a unified nomenclature based on ontogeny. Nat Rev Immunol. (2014) 14:571–58 10.1038/nri3712 - DOI - PMC - PubMed
    1. Dudziak D, Kamphorst AO, Heidkamp GF, Buchholz VR, Trumpfheller C, Yamazaki S, et al. . Differential antigen processing by dendritic cell subsets in vivo. Science (2007) 315:107–11. 10.1126/science.1136080 - DOI - PubMed
    1. Hildner K, Edelson BT, Purtha WE, Diamond M, Matsushita H, Kohyama M, et al. . Batf3 deficiency reveals a critical role for CD8alpha+ dendritic cells in cytotoxic T cell immunity. Science (2008) 322:1097–100. 10.1126/science.1164206 - DOI - PMC - PubMed

Publication types

Substances