Determination of Flavonoids and Carotenoids and Their Contributions to Various Colors of Rose Cultivars (Rosa spp.)
- PMID: 30809238
- PMCID: PMC6379320
- DOI: 10.3389/fpls.2019.00123
Determination of Flavonoids and Carotenoids and Their Contributions to Various Colors of Rose Cultivars (Rosa spp.)
Abstract
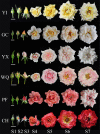
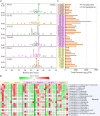
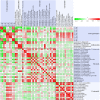
Rose is one of the most valuable ornamental crops worldwide. In this study, the composition of hydrophilic and lipophilic pigments in petals of six rose cultivars at seven developing stages was investigated using high performance liquid chromatography and mass spectrometry. Four anthocyanins, 20 flavonols, and 10 carotenoids were detected in petals of tested cultivars. Major individual anthocyanin, flavonol, and carotenoid were cyanidin/pelargonidin 3,5-diglucoside, kaempferol 3-O-rhamnoside, and (9Z)-violaxanthin, respectively. Significant differences were observed in pigments content in petals of different rose cultivars. The yellow petals of YI and GC exhibited no to very small amounts of anthocyanins, moderate amount of total flavonols, and highest content of total carotenoids. Similarly, pink petals of PF, WQ, and YX showed average concentration of total anthocyanins, highest concentration of total flavonols, and small amount of carotenoids. Further, orange petals of CH showed highest content of total anthocyanins, lowest content of total flavonols, and average content of total carotenoids. Correlation analysis demonstrated that there were many pigments influencing petal colors. Moreover, multiple linear regression indicated that pelargonidin 3,5-diglucoside, total anthocyanins and (9Z)-violaxanthin were the major factors. In addition, this study showed that orange cultivar CH, pink cultivar PF and yellow cultivar YI can have great potential as a natural source for the extraction of pelargonidin 3-O-glucoside, kaempferol 3-O-rhamnoside, and (9Z)-violaxanthin, respectively. These investigations would contribute toward understanding the mechanism on the development of flower colors and provide a theoretical basis for the breeding of rose with specific color.
Keywords: anthocyanins; carotenoids; color; flavonols; petals; rose.
Figures


Similar articles
-
Flavonols and Carotenoids in Yellow Petals of Rose Cultivar ( Rosa 'Sun City'): A Possible Rich Source of Bioactive Compounds.J Agric Food Chem. 2018 Apr 25;66(16):4171-4181. doi: 10.1021/acs.jafc.8b01509. Epub 2018 Apr 11. J Agric Food Chem. 2018. PMID: 29618209
-
Analysis of Flavonoid Metabolism during the Process of Petal Discoloration in Three Malus Crabapple Cultivars.ACS Omega. 2022 Oct 14;7(42):37304-37314. doi: 10.1021/acsomega.2c03820. eCollection 2022 Oct 25. ACS Omega. 2022. PMID: 36312389 Free PMC article.
-
Anthocyanin and Carotenoid Contents in Different Cultivars of Chrysanthemum (Dendranthema grandiflorum Ramat.) Flower.Molecules. 2015 Jun 15;20(6):11090-102. doi: 10.3390/molecules200611090. Molecules. 2015. PMID: 26083041 Free PMC article.
-
Molecular mechanisms underlying the diverse array of petal colors in chrysanthemum flowers.Breed Sci. 2018 Jan;68(1):119-127. doi: 10.1270/jsbbs.17075. Epub 2018 Feb 17. Breed Sci. 2018. PMID: 29681754 Free PMC article. Review.
-
Onions: a source of unique dietary flavonoids.J Agric Food Chem. 2007 Dec 12;55(25):10067-80. doi: 10.1021/jf0712503. Epub 2007 Nov 13. J Agric Food Chem. 2007. PMID: 17997520 Review.
Cited by
-
Effects of Extraction Technique on the Content and Antioxidant Activity of Flavonoids from Gossypium Hirsutum linn. Flowers.Molecules. 2022 Aug 31;27(17):5627. doi: 10.3390/molecules27175627. Molecules. 2022. PMID: 36080389 Free PMC article.
-
Evaluation of antioxidant potential of pigments extracted from Bacillus spp. and Halomonas spp. isolated from mangrove rhizosphere.BioTechnologia (Pozn). 2021 Jul 5;102(2):157-169. doi: 10.5114/bta.2021.106522. eCollection 2021. BioTechnologia (Pozn). 2021. PMID: 36606025 Free PMC article.
-
Bioactivity, Molecular Mechanism, and Targeted Delivery of Flavonoids for Bone Loss.Nutrients. 2023 Feb 12;15(4):919. doi: 10.3390/nu15040919. Nutrients. 2023. PMID: 36839278 Free PMC article. Review.
-
Argentinian Rose Petals as a Source of Antioxidant and Antimicrobial Compounds.Foods. 2024 Mar 22;13(7):977. doi: 10.3390/foods13070977. Foods. 2024. PMID: 38611283 Free PMC article.
-
Integrated transcriptome and metabolome analyses provide molecular insights into the transition of flower color in the rose cultivar 'Juicy Terrazza'.BMC Plant Biol. 2025 Jul 4;25(1):883. doi: 10.1186/s12870-025-06794-2. BMC Plant Biol. 2025. PMID: 40615831 Free PMC article.
References
-
- Arathi B. P., Sowmya P. R., Vijay K., Baskaran V., Lakshminarayana R. (2015). Metabolomics of carotenoids: the challenges and prospects - a review. Trends Food Sci. Tech. 45 105–117. 10.1016/j.tifs.2015.06.003 - DOI
-
- Biolley J., Jay M., Forkmann G. (1994a). Pigmentation patterns of modern rose mutants throw light on the flavonoid pathway in Rosa x hybrida. Phytochemistry 36 1189–1196. 10.1016/S0031-9422(00)89636-3 - DOI
-
- Biolley J., Jay M., Viricel M. (1994b). Flavonoid diversity and metabolism in 100 Rosa x hybrida cultivars. Phytochemistry 35 413–419. 10.1016/S0031-9422(00)94773-3 - DOI
LinkOut - more resources
Full Text Sources
Miscellaneous

