. 2019 Jan 24;9(3):778-795.
doi: 10.7150/thno.29964. eCollection 2019.

Targeted Drug Delivery and Image-Guided Therapy of Heterogeneous Ovarian Cancer Using HER2-Targeted Theranostic Nanoparticles

Affiliations

Targeted Drug Delivery and Image-Guided Therapy of Heterogeneous Ovarian Cancer Using HER2-Targeted Theranostic Nanoparticles

Minati Satpathy et al. Theranostics. .

Abstract

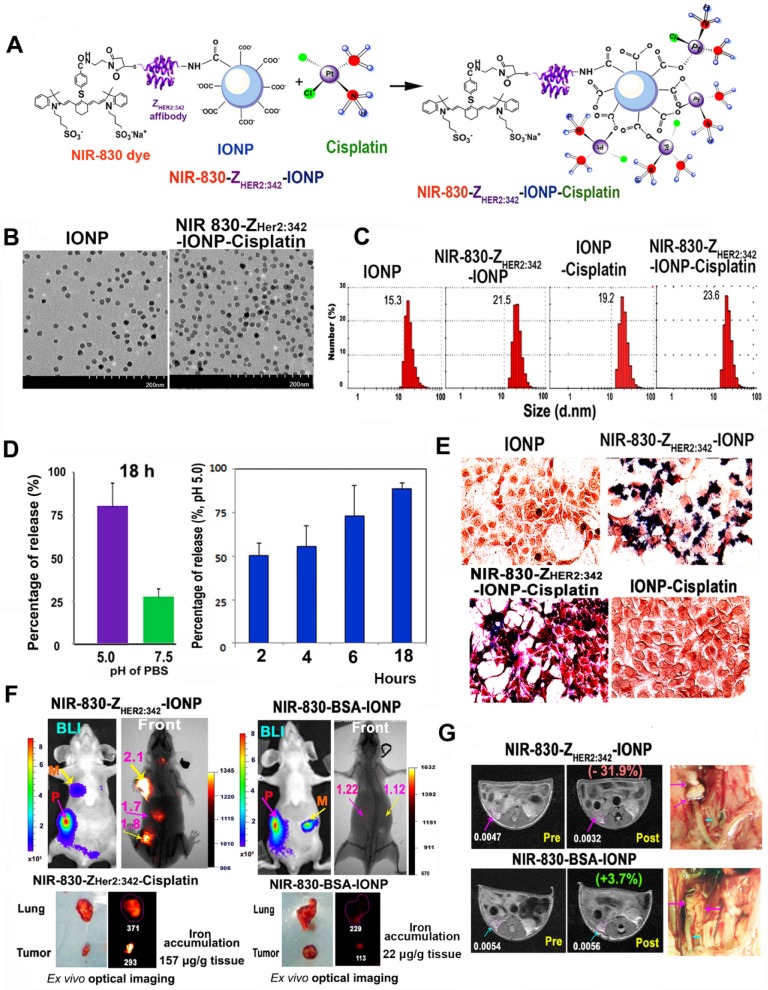
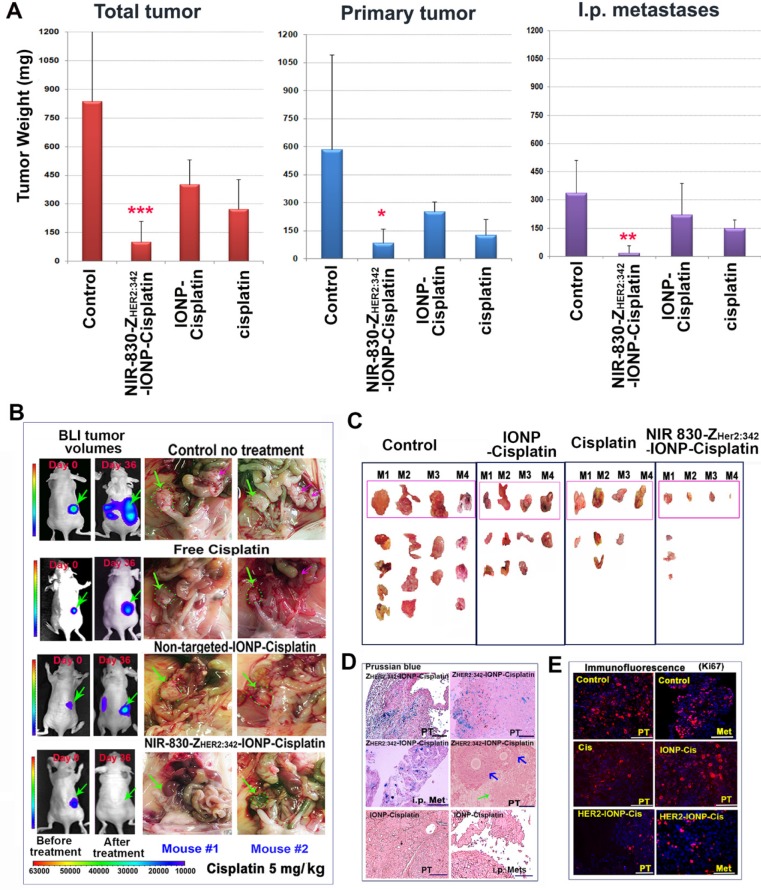
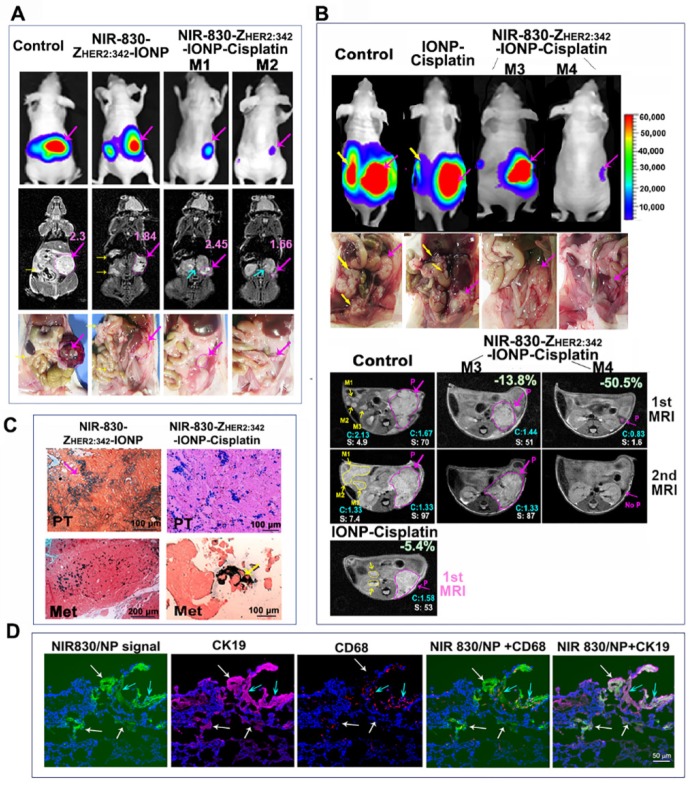
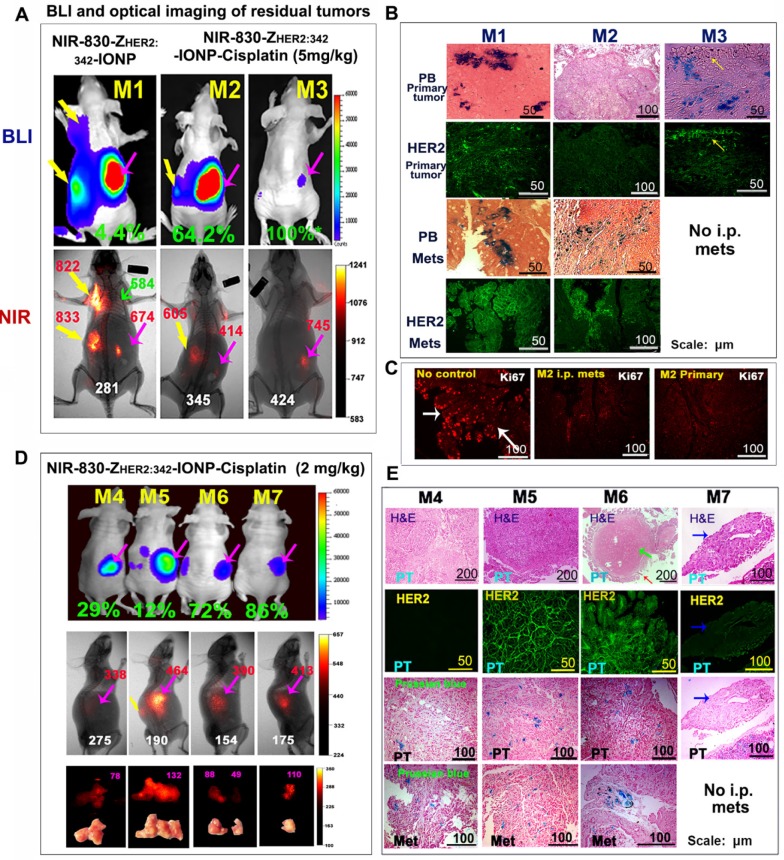
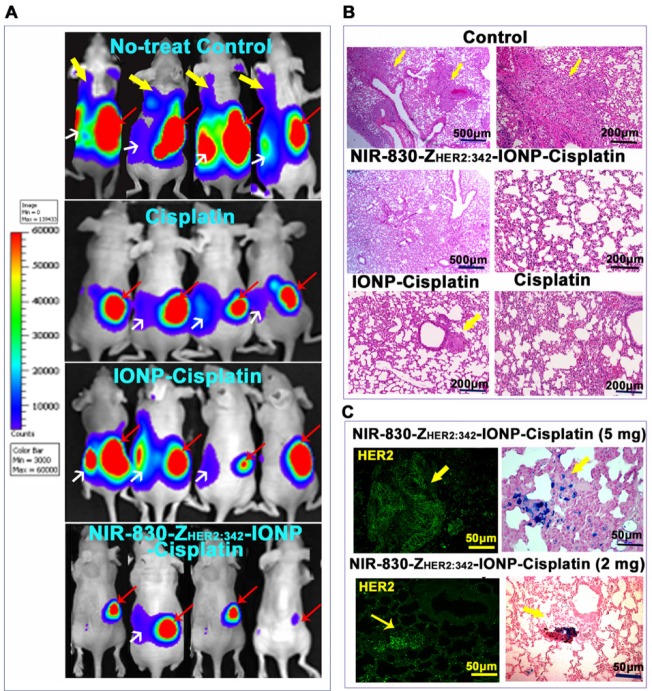
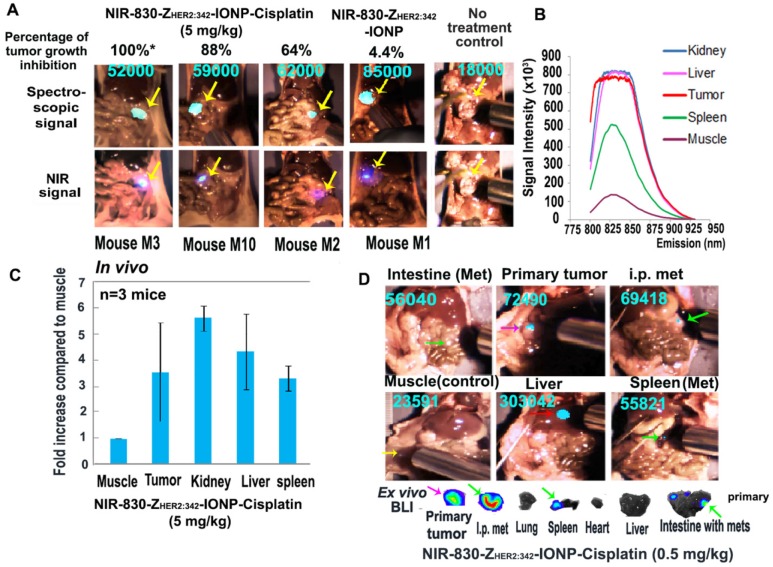
Cancer heterogeneity and drug resistance limit the efficacy of cancer therapy. To address this issue, we have developed an integrated treatment protocol for effective treatment of heterogeneous ovarian cancer. Methods: An amphiphilic polymer coated magnetic iron oxide nanoparticle was conjugated with near infrared dye labeled HER2 affibody and chemotherapy drug cisplatin. The effects of the theranostic nanoparticle on targeted drug delivery, therapeutic efficacy, non-invasive magnetic resonance image (MRI)-guided therapy, and optical imaging detection of therapy resistant tumors were examined in an orthotopic human ovarian cancer xenograft model with highly heterogeneous levels of HER2 expression. Results: We found that systemic delivery of HER2-targeted magnetic iron oxide nanoparticles carrying cisplatin significantly inhibited the growth of primary tumor and peritoneal and lung metastases in the ovarian cancer xenograft model in nude mice. Differential delivery of theranostic nanoparticles into individual tumors with heterogeneous levels of HER2 expression and various responses to therapy were detectable by MRI. We further found a stronger therapeutic response in metastatic tumors compared to primary tumors, likely due to a higher level of HER2 expression and a larger number of proliferating cells in metastatic tumor cells. Relatively long-time retention of iron oxide nanoparticles in tumor tissues allowed interrogating the relationship between nanoparticle drug delivery and the presence of resistant residual tumors by in vivo molecular imaging and histological analysis of the tumor tissues. Following therapy, most of the remaining tumors were small, primary tumors that had low levels of HER2 expression and nanoparticle drug accumulation, thereby explaining their lack of therapeutic response. However, a few residual tumors had HER2-expressing tumor cells and detectable nanoparticle drug delivery but failed to respond, suggesting additional intrinsic resistant mechanisms. Nanoparticle retention in the small residual tumors, nevertheless, produced optical signals for detection by spectroscopic imaging. Conclusion: The inability to completely excise peritoneal metastatic tumors by debulking surgery as well as resistance to chemotherapy are the major clinical challenges for ovarian cancer treatment. This targeted cancer therapy has the potential for the development of effective treatment for metastatic ovarian cancer.

Keywords: MR image-guided cancer therapy; resistant mechanism; spectroscopic imaging; targeted drug delivery; theranostic nanoparticles.


Conflict of interest statement

Competing interests: Dr. Y. Andrew Wang is the President and Principal Scientist at Ocean Nanotech LLC, San Diego, CA. All other authors have declared that no conflict of interest exists.

Figures

Figure 1
Figure 1
Development of an integrated protocol of targeted drug delivery and image-guided therapy. (A) Schematic illustration of targeted and image-guided therapy of advanced ovarian cancer with heterogeneous HER2 expression using theranostic nanoparticles. Systemic delivery of HER2 targeted theranostic nanoparticles leads to drug accumulation in HER2-expressing ovarian tumors. MRI can be used to evaluate nanoparticle drug delivery in individual tumors with different levels of HER2 in the peritoneal cavity. It can also assesse therapeutic response in tumors. Residual tumors, due to a low level of HER2 or intrinsic drug resistance, produce NIR signals for detection and removal by image-guided surgery. (B) Orthotopic ovarian cancer xenograft model derived from HER2+ human ovarian cancer SKOV3-luc cell line was established by direct injection of cells into the ovary of nude mice. Growth and staging of the tumor could be identified by BLI. Bright-field images were included for visualizing tumor locations. H&E-stained tissue sections showed stage I tumor in the ovary (PT, green arrow), stage III with i.p. metastases (blue arrows), and stage IV with lung metastases. Red arrow: normal follicle. Yellow arrow: intestine. (C) Immunohistochemical staining of tumor tissue sections collected from two representative mice using an anti-HER2 antibody. The levels of HER2 expression from negative to strongly positive were detected in four tumors in Mouse #1 and three tumors in Mouse #2. Normal pancreas: a negative control for HER2 labeling. Dual immunofluorescence labeling of HER2 (green) and Ki67 (red) of primary and metastatic tumors showed metastatic tumors had a higher level of HER2 and more proliferating cells (red) than primary tumors. Blue: Hoechst 33342 nuclear staining. Scale bars: 100 μm.
Figure 2
Figure 2
Characterization of HER2-targeted theranostic nanoparticle carrying cisplatin. (A) Production of HER2-targeted theranostic nanoparticle, NIR-830-ZHER2:342-IONP-Cisplatin. (B) Electron microscopy images of different IONPs. (C) Dynamic light scattering analysis of nanoparticle sizes. (D) Platinum-loaded, HER2 targeted IONPs showed faster drug release in pH 5.0 buffer than that under pH 7.5. Percentage of drug release was calculated from the initial drug content of NIR-830-ZHER2:342-IONP-Cisplatin. (E) In vitro target specificity detected by Prussian blue staining. (F) In vivo targeted delivery. Optical imaging at 48 h following the second i.v. injection of 400 picomolar (pmol) of NIR-830-ZHER2:342-IONP. Primary tumor (pink arrow) and metastatic lesions in the peritoneal cavity and lung (yellow arrows). Imaging results performed after the first injection is shown in Figure S2. There was no bright optical signal in the mice received non-targeted NIR-830-BSA-IONP. Locations of tumors were identified by bioluminescence imaging (BLI). Pink numbers: ratio of optical signal in tumor and body background. Ex vivo imaging confirmed stronger optical signal in primary tumor and lung metastases in targeted IONP treated mice than those treated with non-targeted IONPs. Chemical analysis of iron concentrations in the primary tumors are shown. (G) T2-weighted MRI performed Pre and 24-h post i.v. delivery of NIR-830-ZHER2:342-IONP showed a signal intensity decrease of T2-weighted MRI in the primary tumor (~5 mm in diameter) (pink arrows). No T2 signal intensity decrease was seen in the tumor of the mice that received non-targeted NIR-830-BSA-IONP. White numbers: the mean relative signal intensity in tumors. Bright field images of the peritoneal cavity showed primary tumors in the ovary (pink arrows). Blue arrow: fallopian tube.
Figure 3
Figure 3
Therapeutic effect of HER2-targeted IONP-Cisplatin on primary and metastatic ovarian tumors. (A) Tumor weights of primary and metastatic tumors following 5 mg/kg of cisplatin dose twice per week for a total of six treatments. The mean tumor weights of total visible tumors collected from the peritoneal cavity, primary tumor, and i.p. metastatic tumors (Mets) are shown. (n = 6-8 mice/ control, cisplatin and targeted IONP groups; n = 3 mice/IONP-Cisplatin). Student's t-test: No treatment vs. targeted IONP-Cisplatin: total tumor: p=0.004, Primary tumor: p=0.026, Mets: p=0.006. Targeted-IONP-Cisplatin vs cisplatin: total tumor: p=0.02. Primary tumor: p=0.035, Mets: p=0.005. (B) Therapeutic responses in two representative mice shown as BLI images and bright-field pictures that identified tumors in the peritoneal cavity. Green arrows: primary tumors. Pink arrows: i.p. metastases. (C) Ex vivo pictures of tumors collected from mouse groups. Primary tumor: top pink boxed. Multiple i.p. metastases from mouse groups are shown (n = 4 mice/group). Three of four mice treated with targeted IONP-Cisplatin lack visible i.p. metastases. (D) Prussian blue staining of tumor tissue sections showed the presence of IONP in primary tumor (PT) and i.p. metastases (Mets) in targeted IONP-Cisplatin treated mice. Some residual primary tumor areas (green arrow) and adjacent normal follicle (blue arrows) lacked IONP positive cells. Non-targeted IONP-Cisplatin treated tumors showed a very low level of IONP positive cells. (E) Immunofluorescence labeling of cell proliferation marker Ki67. A low level of Ki67 positive cells (red) was found in the primary and metastatic tumors treated with NIR-830-ZHER2:342-IONP-Cisplatin (HER2-IONP-Cis). Blue: Hoechst 33342 nuclear staining. Scale bar: 100 µm.
Figure 4
Figure 4
Non-invasive MRI detection of response to targeted therapy following systemic delivery of HER2-targeted theranostic IONP-Cisplatin. (A) T2-weighted MRI. Two days following the sixth therapy, BLI and coronal MR images showed tumor sizes and MRI contrasts in good responder (M2), intermediate responder (M1), no-treatment and targeted IONP (no drug) control mice. Mouse M2 had a smaller tumor and lower T2 signal intensity than those in mouse M1, suggesting a higher level of theranostic IONP accumulation in mouse M2 that led to a better response. (B) Transverse MR images. No-treatment control mouse following the fifth treatment (1st MRI) had a large primary tumor and several large metastases with a high T2 signal intensity. Good responder (M4) had a very small primary tumor with a decreased T2 signal intensity. The intermediate responder (M3) had a primary tumor with a 13.8% T2 signal intensity reduction compared with no treatment control. Both mice had no visible i.p. metastases. IONP-Cisplatin treated tumor had an intermediate size primary tumor and detectable i.p. metastases with a high T2 signal intensity. The second MRI after sixth treatment revealed progressive growth of primary and metastatic tumors in the control mice. A small tumor in the good responder mouse M4 became invisible on the MR image. The primary tumor in mouse M3 continued to grow and did not show a decrease in T2 signal intensity. Pink arrows and line-circled areas: primary tumor. Yellow arrows: i.p. metastatic tumors; blue arrow: kidney. P: primary tumor. M1-3: selected i.p. metastases for quantification. Numbers in blue color C: the mean value of T2 signal intensity of identifiable tumor areas in all MR image slices. Number shown as white S: quantification of the tumor areas of the primary and selected i.p. metastases in pixel in one representative MRI slice as shown. (C) Prussian blue staining in primary (PT) and i.p. metastatic (Met) tumor tissue sections. (D) Double immunofluorescence labeling to identify tumor cells (CK19, purple), and macrophage (CD68, red). NIR signal of nanoparticles (green). Blue fluorescence: Hoechst 33342. White arrows: IONPs in tumor cells. Blue arrows: IONPs in macrophages.
Figure 5
Figure 5
Correlation of differential therapeutic responses, optical signals and the levels of HER2 expression in drug resistant tumors. (A) BLI and optical imaging of residual tumors following the sixth treatment at 5 mg/kg cisplatin dose. BLI signal quantification: NIR-830-ZHER2:342-IONP-Cisplatin treated mouse M2 (1.4x10⁸ photon/second) and mouse M3 (1.6x10⁶ photon/second). NIR-830-ZHER2:342-IONP (no drug) treated mouse M1 (2.5x10⁹ photon/second). Lung and i.p. metastases (yellow arrows); primary tumor (pink arrows). Green arrow: normal lung. (B) Prussia blue staining (PB) and immunofluorescence labeling. Higher levels of IONPs were detected in i.p. metastases compared to primary tumors. Mouse M2 lacked HER2 and IONP accumulation in the primary tumor and had a low level of HER2 in most metastatic tumor cells except in a subpopulation. Mouse M3 had IONP positive cells and a low level of HER2+ cells in a microscopic residual primary tumor. (C) Cell proliferation (Ki67+, red) in both primary and metastatic tumors was inhibited in mouse M2. (D) BLI and optical imaging of mice treated with a 2 mg/kg cisplatin dose of NIR-830-ZHER2:342-IONP-Cisplatin. (E) Residual tumors of mouse M4 and M5 had dense tumor cells in H&E images. Primary tumor in mouse M4 lacked HER2 and had a low level of IONPs. A poor responder mouse M5 had high levels of HER2 and IONPs in the tumor. Mouse M6 had large necrotic areas (green arrow) in the primary tumor, while having viable HER2+ and IONP positive tumor cells at the tumor edge (red arrow). A good responder mouse M7 had a small and HER2 low expressing residual tumor. A and D: Green numbers: the percentages of tumor growth inhibition based on the tumor weight of no treatment control mice as 0%. Red numbers: optical intensity in tumors. White numbers: body background. Pink numbers: optical signal intensity measured on tumors by ex vivo imaging.
Figure 6
Figure 6
Systemic delivery of HER2-targeted theranostic IONP-Cisplatin inhibited the growth of metastatic tumors in orthotopic human ovarian cancer model. (A) BLI shows the presence of lung and i.p. metastases in all no-treatment control mice (upper panel). Six i.v. injections of a 5 mg/kg cisplatin equivalent dose of NIR-830-ZHER2:342-IONP-Cisplatin markedly inhibited the lung and i.p. metastases (bottom panel). Mice treated with unconjugated cisplatin or non-targeted IONP-Cisplatin also showed inhibition of lung metastasis but still had large i.p. metastases and primary tumors. Red arrows: primary tumors; White arrows: i.p. metastases; Yellow arrows: lung metastases. (B) H&E staining of lung tissue sections from different groups. Large metastatic tumors were detected in the lungs of no-treatment control mice but none in mice treated with targeted IONP-Cisplatin. Low (100x) and high magnification (200x) microscopic images of the lung are shown. Small metastatic lesions were seen in the lung of the mice treated with non-targeted IONP-Cisplatin. A few lung metastatic lesions were seen in cisplatin-treated mice. (C) Immunofluorescence labeling and Prussian blue staining of serial tissue sections detected targeted delivery of NIR-830-ZHER2:342-IONP-Cisplatin to HER2-expressing lung metastases (yellow arrows).
Figure 7
Figure 7
Detection of drug-resistant residual tumors in the peritoneal cavity using a handheld dual spectroscopic and NIR imaging device. (A) Spectroscopic signals in small and large drug-resistant residual tumors in mice treated with NIR-830-ZHER2:342-IONP-Cisplatin (5 mg/kg). An intermediate level of spectroscopic signal was detected near the ovary in mouse M3 without a visible tumor. Delivery control: tumors treated with NIR-830-ZHER2:342-IONP (no drug). Background control: basal signal in the tumor of no-treated control mouse. The percentage of tumor growth inhibition was calculated using the mean total tumor weight of no treatment control mice of 837 mg as 0% growth inhibition. Mouse M1: 800 mg (4.4%), mouse M2: 300 mg (64%), mouse M10: 100 mg (88%). Mouse M3: No visible tumor and only microscopic tumor (100%*). (B) Quantification of spectroscopic signals. The peak signal was at an emission wavelength of 830 nm. Tumor signal is 7 times higher than that in the muscle. Nonspecific signals in the liver and kidney were detected. (C) The mean spectroscopic signal intensity detected from three mice. All small and large tumors had signal intensity 2 to 5 times over the muscle background. The error bars are standard deviations from one measurement on each organ of three mice. (D) Detection of peritoneal metastatic tumors on the surface of normal organs. Despite a low dose of theranostic IONPs (0.5 mg/kg cisplatin), spectroscopic imaging detected strong signals in the primary (pink arrow) and metastatic tumors (green arrows). Several small tumor nodules on the surface of the intestine and spleen identified by ex vivo BLI (green arrows) had spectroscopic imaging signals two-fold higher than muscle background (yellow arrows). Red arrow: liver nonspecific signal.

Similar articles

Cited by

References

    1. Scott AM, Wolchok JD, Old LJ. Antibody therapy of cancer. Nat Rev Cancer. 2012;12:278–87. - PubMed
    1. Talavera A, Friemann R, Gomez-Puerta S, Martinez-Fleites C, Garrido G, Rabasa A. et al. Nimotuzumab, an antitumor antibody that targets the epidermal growth factor receptor, blocks ligand binding while permitting the active receptor conformation. Cancer Res. 2009;69:5851–9. - PubMed
    1. Sievers EL, Senter PD. Antibody-drug conjugates in cancer therapy. Annu Rev Med. 2013;64:15–29. - PubMed
    1. Baselga J, Cortes J, Kim SB, Im SA, Hegg R, Im YH. et al. Pertuzumab plus trastuzumab plus docetaxel for metastatic breast cancer. N Engl J Med. 2012;366:109–19. - PMC - PubMed
    1. Swain SM, Clark E, Baselga J. Treatment of HER2-positive metastatic breast cancer. N Engl J Med. 2015;372:1964–5. - PMC - PubMed

Publication types

MeSH terms