

Dual-microRNA-controlled double-amplified cascaded logic DNA circuits for accurate discrimination of cell subtypes
- PMID: 30809361
- PMCID: PMC6354832
- DOI: 10.1039/c8sc04887h
Dual-microRNA-controlled double-amplified cascaded logic DNA circuits for accurate discrimination of cell subtypes
Abstract
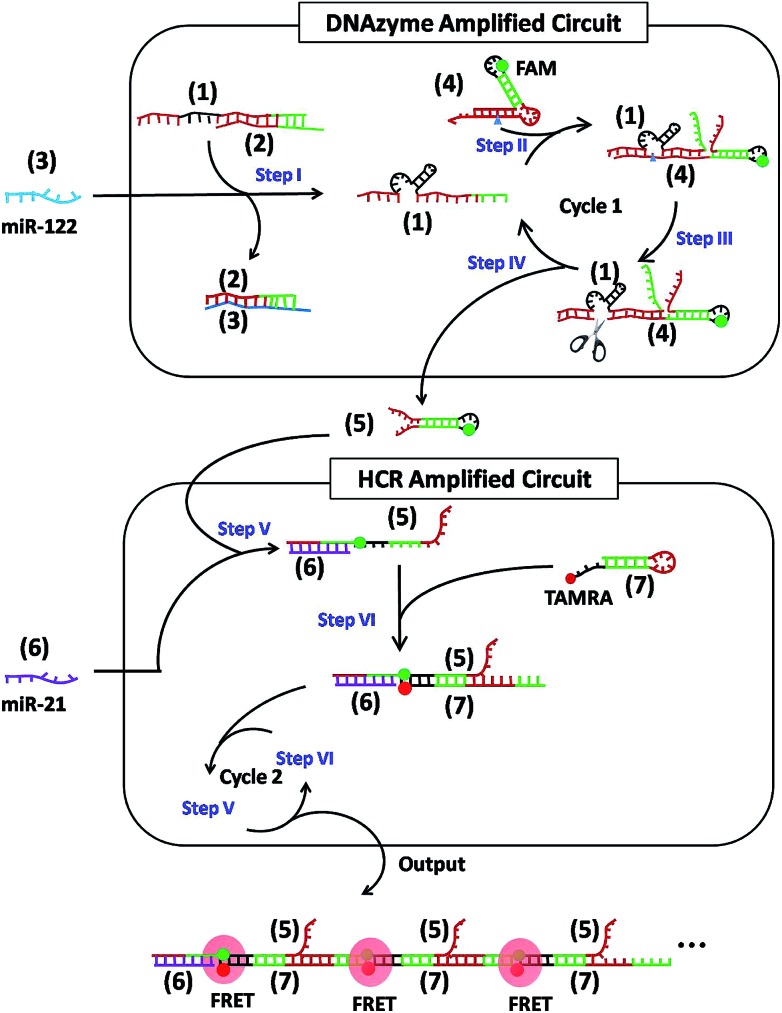
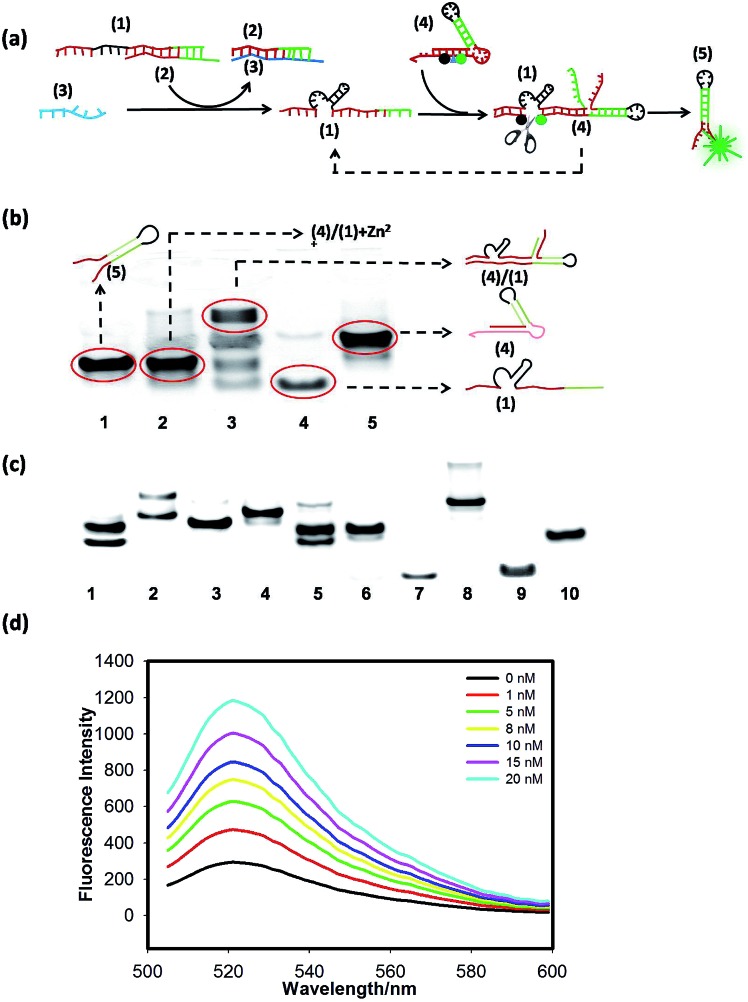
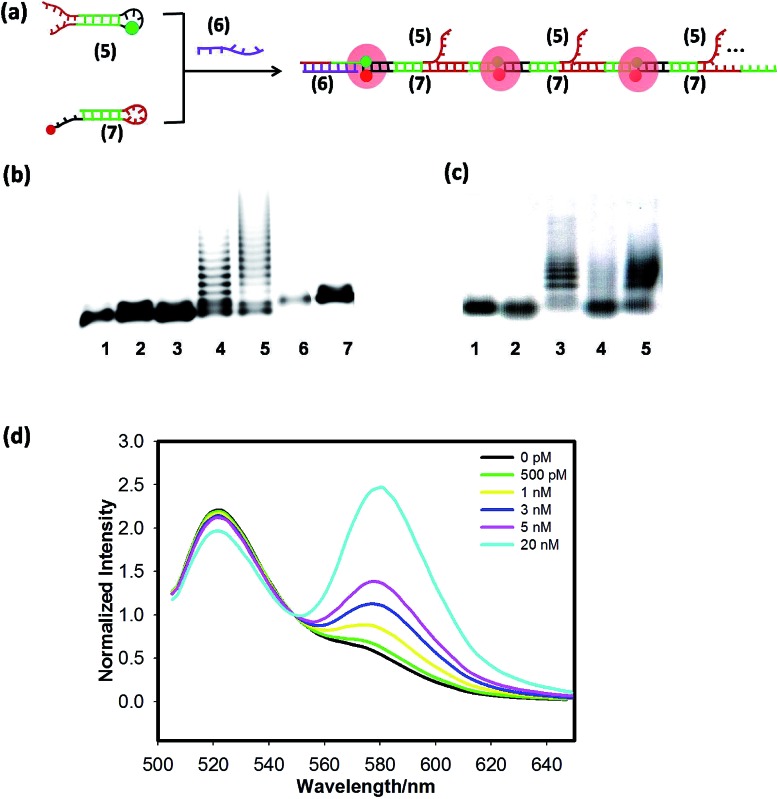
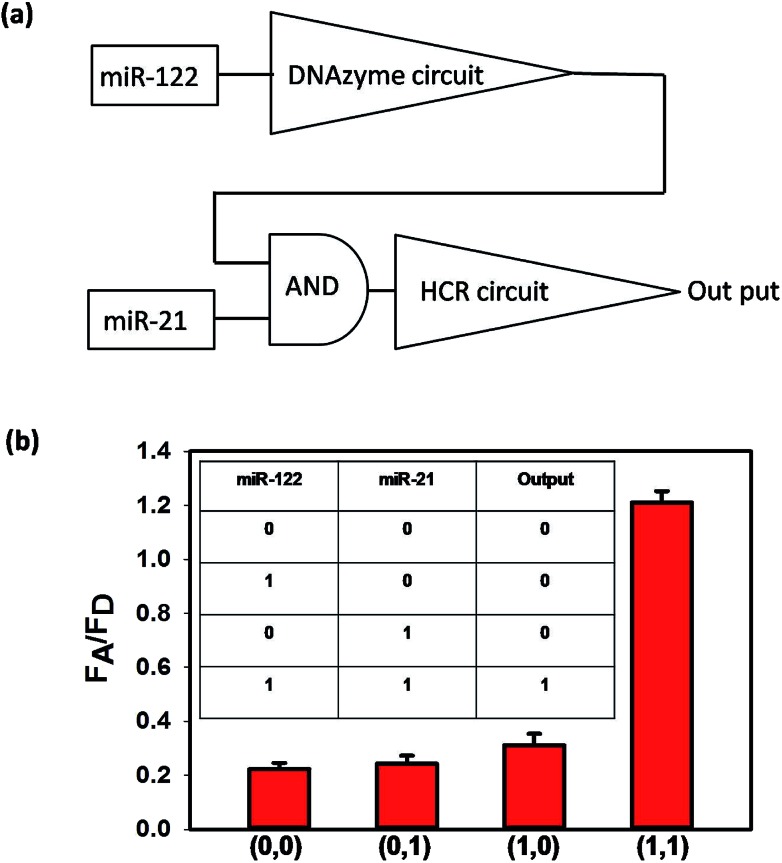
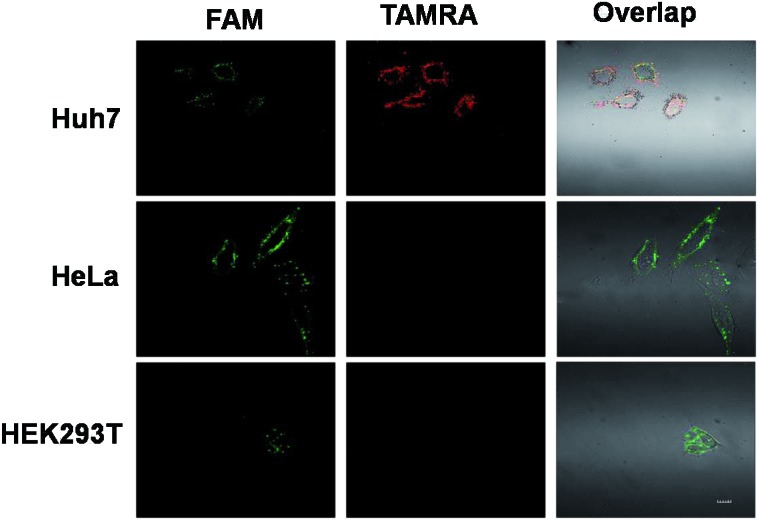
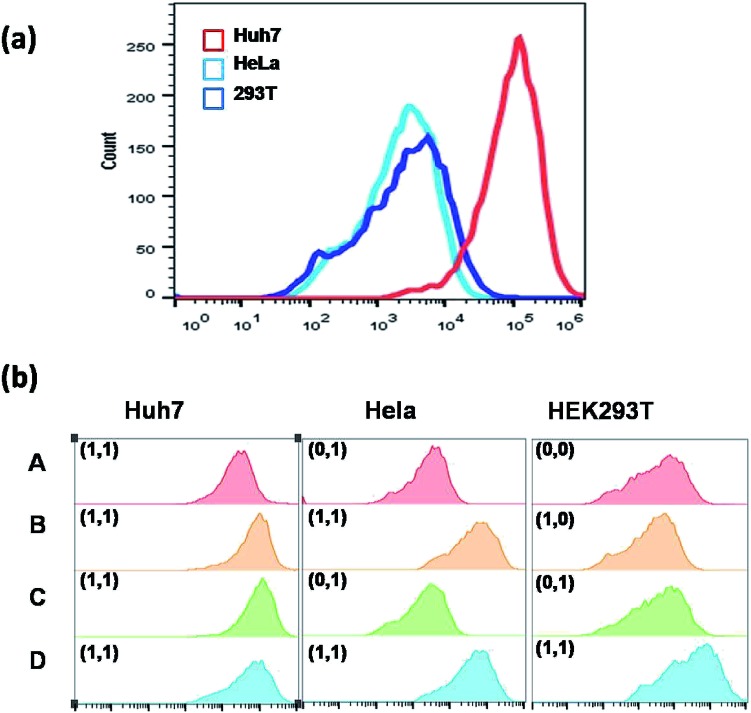
Accurate discrimination between different cells at the molecular level is particularly important for disease diagnosis. Endogenous RNAs are such molecular candidates for cancer cell subtype identification. But the key is that there is often low abundance of RNAs in live cells, or some RNAs are often shared by multiple types of cells. Thus, we have designed dual-microRNA-controlled double-amplified cascaded logic DNA circuits for cancer cell subtype identification. The basic idea is to improve sensitivity by cascading DNAzyme and hybridization chain reaction (HCR), and improve accuracy by simultaneous detection of miR-122 and miR-21. The in-tube and in-cell experimental results show that the cascaded logic DNA circuits can work and serve to differentiate the liver cancer cells Huh7 from other normal cells and cancer cells. We anticipate that this design can be widely applied in facilitating basic biomedical research and accurate disease diagnosis.
Figures
Similar articles
-
The compact integration of a cascaded HCR circuit for highly reliable cancer cell discrimination.Chem Sci. 2023 Jan 24;14(8):2159-2167. doi: 10.1039/d2sc05568f. eCollection 2023 Feb 22. Chem Sci. 2023. PMID: 36845932 Free PMC article.
-
MiRNA and mRNA-Controlled Double-Cascaded Amplifying Circuit Nanosensor for Accurate Discrimination of Breast Cancers in Living Cells, Animals, and Organoids.Anal Chem. 2024 Mar 12;96(10):4154-4162. doi: 10.1021/acs.analchem.3c05085. Epub 2024 Mar 1. Anal Chem. 2024. PMID: 38426698
-
Electrochemiluminescence Cascade Amplification Platform for Detection of Dual-microRNA and Operation of Concatenated Logic Circuit.Anal Chem. 2022 Dec 13;94(49):17279-17286. doi: 10.1021/acs.analchem.2c04242. Epub 2022 Nov 30. Anal Chem. 2022. PMID: 36448919
-
Membrane Protein and Extracellular Acid Heterogeneity-Driven Amplified DNA Logic Gate Enables Accurate and Sensitive Identification of Cancer Cells.Anal Chem. 2022 Feb 8;94(5):2502-2509. doi: 10.1021/acs.analchem.1c04347. Epub 2022 Jan 28. Anal Chem. 2022. PMID: 35089704
-
DNA Logic Circuits for Cancer Theranostics.Small. 2022 May;18(20):e2108008. doi: 10.1002/smll.202108008. Epub 2022 Mar 7. Small. 2022. PMID: 35254723 Review.
Cited by
-
Propelling DNA Computing with Materials' Power: Recent Advancements in Innovative DNA Logic Computing Systems and Smart Bio-Applications.Adv Sci (Weinh). 2020 Nov 9;7(24):2001766. doi: 10.1002/advs.202001766. eCollection 2020 Dec. Adv Sci (Weinh). 2020. PMID: 33344121 Free PMC article. Review.
-
Targeted and direct intracellular delivery of native DNAzymes enables highly specific gene silencing.Chem Sci. 2020 Aug 7;11(33):8966-8972. doi: 10.1039/d0sc03974h. Chem Sci. 2020. PMID: 34123151 Free PMC article.
-
An Exo III-powered closed-loop DNA circuit architecture for biosensing/imaging.Mikrochim Acta. 2024 Jun 14;191(7):395. doi: 10.1007/s00604-024-06476-0. Mikrochim Acta. 2024. PMID: 38877347
-
Advances in Applications of Molecular Logic Gates.ACS Omega. 2021 Nov 6;6(45):30189-30204. doi: 10.1021/acsomega.1c02912. eCollection 2021 Nov 16. ACS Omega. 2021. PMID: 34805654 Free PMC article. Review.
-
Smart DNA sensors-based molecular identification for cancer subtyping.Smart Mol. 2023 Dec 12;1(3):e20230020. doi: 10.1002/smo.20230020. eCollection 2023 Dec. Smart Mol. 2023. PMID: 40626205 Free PMC article. Review.
References
-
- Bhattacharya S., Mariani T. J. Biochem. Soc. Trans. 2009;37:855. - PubMed
LinkOut - more resources
Full Text Sources