

Subjective wellbeing at different spatial scales for individuals satisfied and dissatisfied with life
- PMID: 30809461
- PMCID: PMC6387756
- DOI: 10.7717/peerj.6502
Subjective wellbeing at different spatial scales for individuals satisfied and dissatisfied with life
Abstract
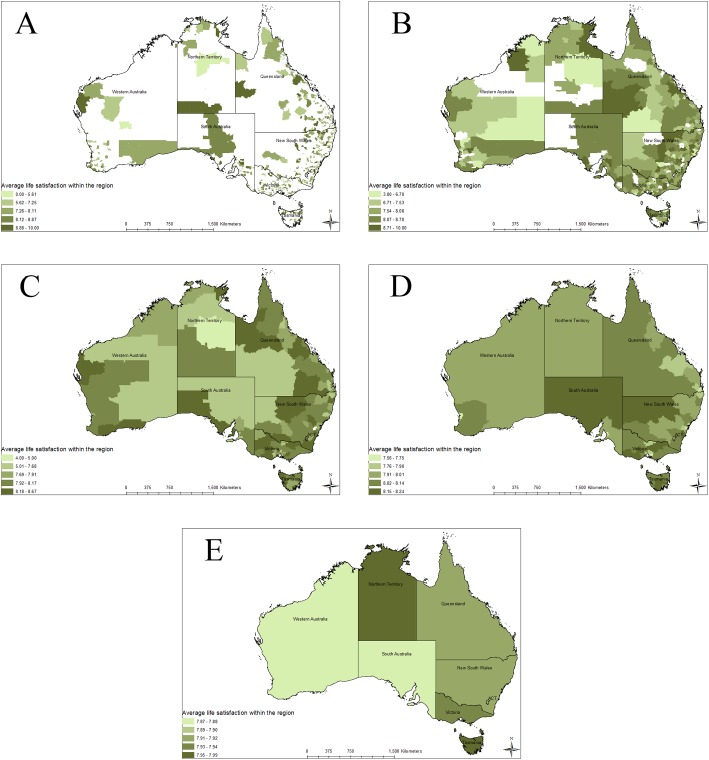
Indicators that attempt to gauge wellbeing have been created and used at multiple spatial scales around the world. The most commonly used indicators are at the national level to enable international comparisons. When analyzing subjective life satisfaction (LS), an aspect of wellbeing, at multiple spatial scales in Australia, variables (drawn from environmental, social, and economic domains) that are significantly correlated to LS at smaller scales become less significant at larger sub-national scales. The reverse is seen for other variables, which become more significant at larger scales. Regression analysis over multiple scales on three groups (1) all individuals within the sample, (2) individuals with self-reported LS as dissatisfied (LS ≤ 5), and (3) individuals self-reporting LS as satisfied (LS > 5), show that variables critical for LS differ between subgroups of the sample as well as by spatial scale. Wellbeing measures need to be created at multiple scales appropriate to the purpose of the indicator. Concurrently, policies need to address the factors that are important to wellbeing at those respective scales, segments, and values of the population.
Keywords: Australia; Global progress; Life satisfaction; Spatial scales; Wellbeing.
Conflict of interest statement
Ida Kubiszewski is an Academic Editor for PeerJ.
Figures
References
-
- Ambrey C, Fleming C. Public greenspace and life satisfaction in urban Australia. Urban Studies. 2014;51(6):1290–1321. doi: 10.1177/0042098013494417. - DOI
-
- Ambrey CL, Fleming CM, Manning M. Perception or reality, what matters most when it comes to crime in your neighbourhood? Social Indicators Research. 2014;119(2):877–896. doi: 10.1007/s11205-013-0521-6. - DOI
-
- Andreasson U. In the shadow of happiness. Copenhagen: Nordic Council of Ministers; 2018.
-
- Aycan Z, Berry JW. Impact of employment-related experiences on immigrants’ psychological well-being and adaptation to Canada. Canadian Journal of Behavioural Science/Revue canadienne des sciences du comportement. 1996;28(3):240–251. doi: 10.1037/0008-400x.28.3.240. - DOI
-
- Bache I, Reardon L, Anand P. Wellbeing as a wicked problem: navigating the arguments for the role of government. Journal of Happiness Studies. 2016;17(3):893–912. doi: 10.1007/s10902-015-9623-y. - DOI
LinkOut - more resources
Full Text Sources
