

Mangiferin Improved Palmitate-Induced-Insulin Resistance by Promoting Free Fatty Acid Metabolism in HepG2 and C2C12 Cells via PPAR α: Mangiferin Improved Insulin Resistance
- PMID: 30809553
- PMCID: PMC6369470
- DOI: 10.1155/2019/2052675
Mangiferin Improved Palmitate-Induced-Insulin Resistance by Promoting Free Fatty Acid Metabolism in HepG2 and C2C12 Cells via PPAR α: Mangiferin Improved Insulin Resistance
Abstract
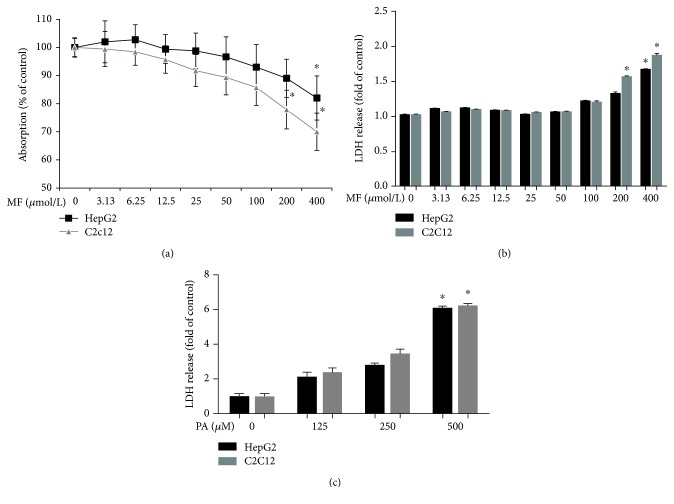
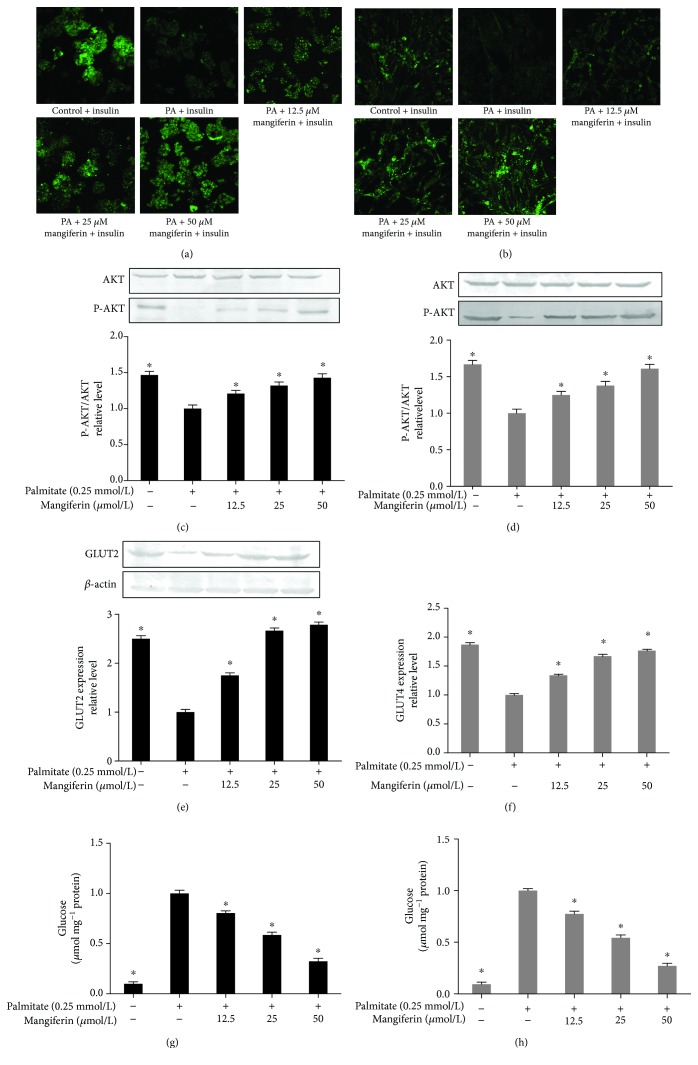
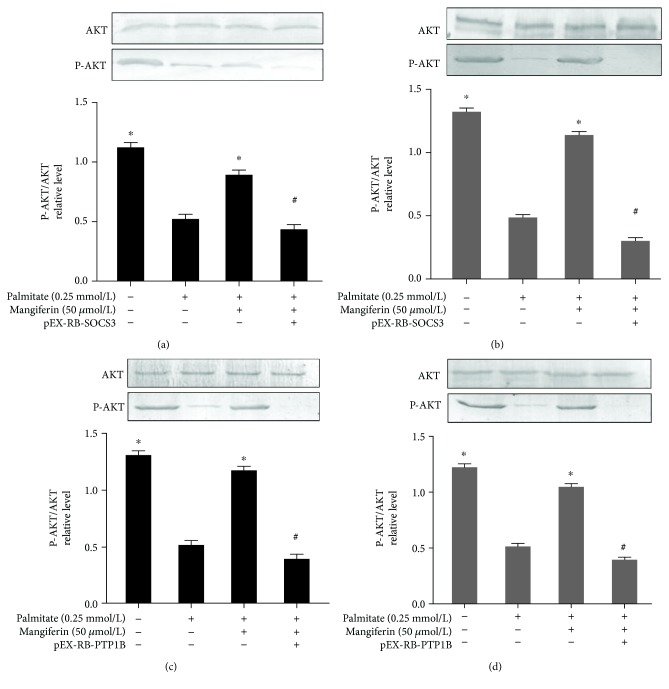
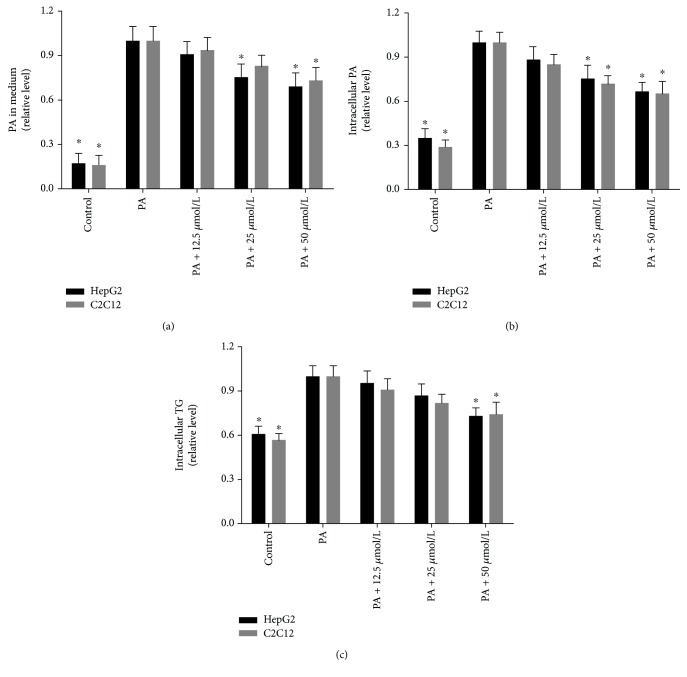
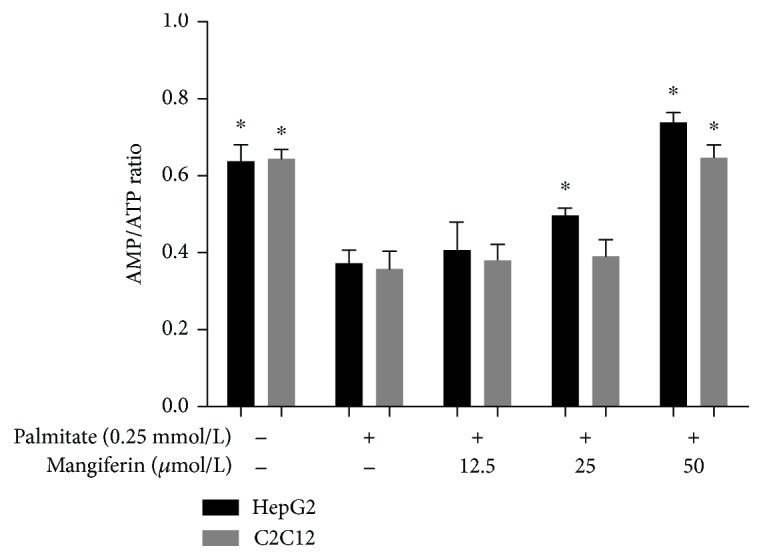
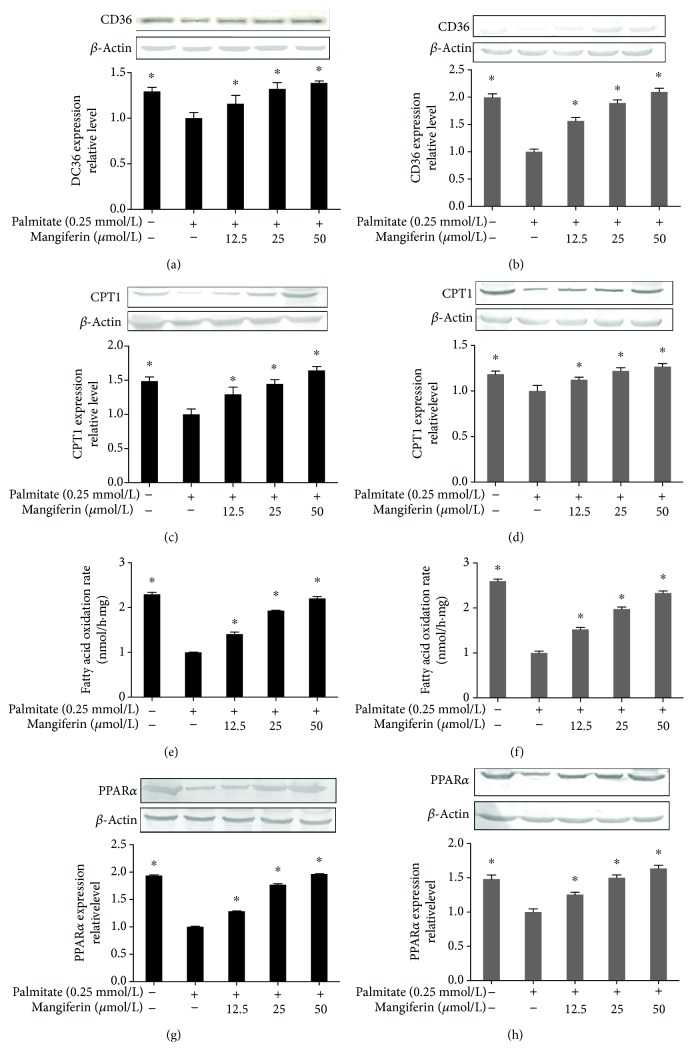
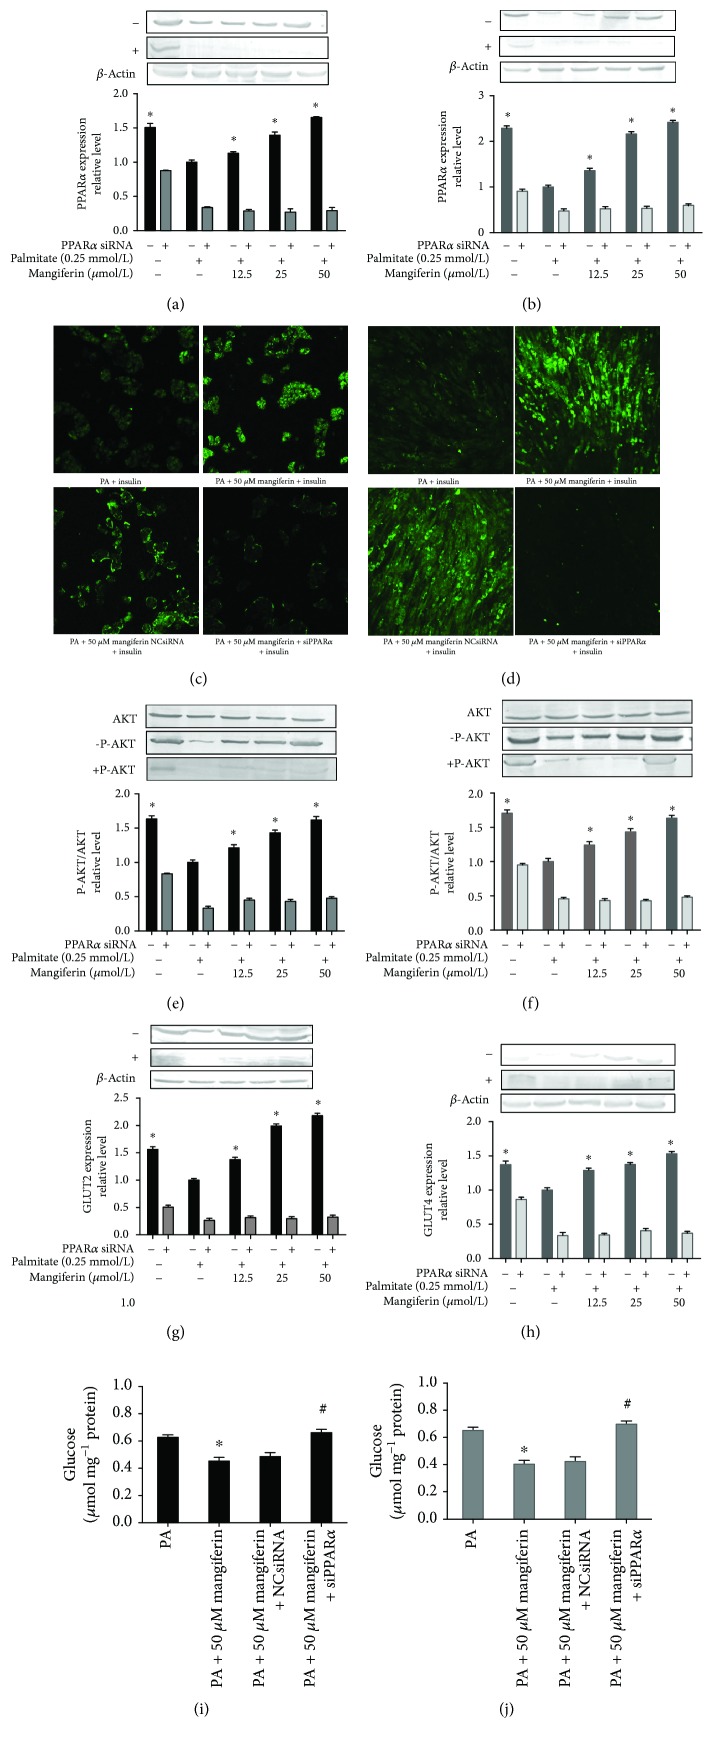
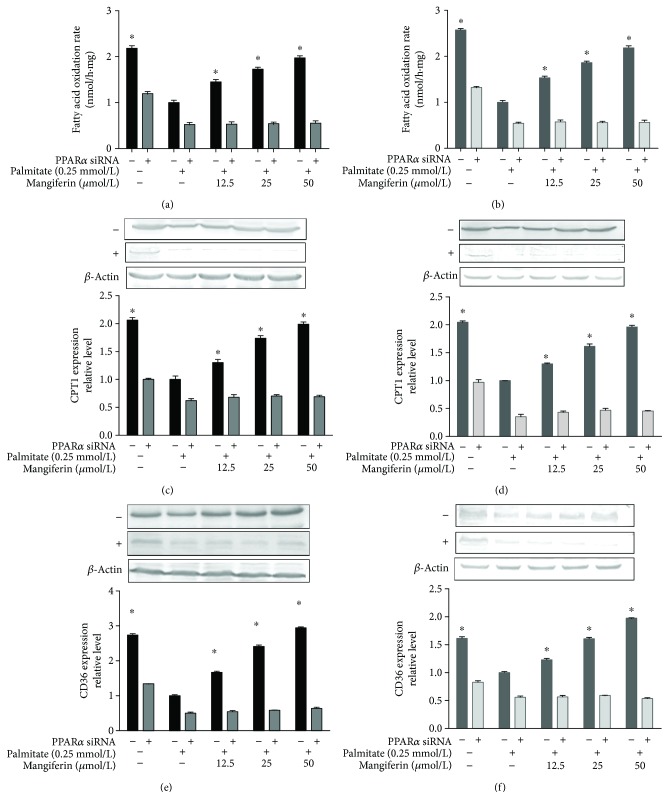
Elevated free fatty acid (FFA) is a key risk factor for insulin resistance (IR). Our previous studies found that mangiferin could decrease serum FFA levels in obese rats induced by a high-fat diet. Our research was to determine the effects and mechanism of mangiferin on improving IR by regulating FFA metabolism in HepG2 and C2C12 cells. The model was used to quantify PA-induced lipid accumulation in the two cell lines treated with various concentrations of mangiferin simultaneously for 24 h. We found that mangiferin significantly increased insulin-stimulated glucose uptake, via phosphorylation of protein kinase B (P-AKT), glucose transporter 2 (GLUT2), and glucose transporter 4 (GLUT4) protein expressions, and markedly decreased glucose content, respectively, in HepG2 and C2C12 cells induced by PA. Mangiferin significantly increased FFA uptake and decreased intracellular FFA and triglyceride (TG) accumulations. The activity of the peroxisome proliferator-activated receptor α (PPARα) protein and its downstream proteins involved in fatty acid translocase (CD36) and carnitine palmitoyltransferase 1 (CPT1) and the fatty acid β-oxidation rate corresponding to FFA metabolism were also markedly increased by mangiferin in HepG2 and C2C12 cells. Furthermore, the effects were reversed by siRNA-mediated knockdown of PPARα. Mangiferin ameliorated IR by increasing the consumption of glucose and promoting the FFA oxidation via the PPARα pathway in HepG2 and C2C12 cells.
Figures
Similar articles
-
Mangiferin decreases plasma free fatty acids through promoting its catabolism in liver by activation of AMPK.PLoS One. 2012;7(1):e30782. doi: 10.1371/journal.pone.0030782. Epub 2012 Jan 23. PLoS One. 2012. PMID: 22292039 Free PMC article.
-
Beneficial effects of mangiferin on hyperlipidemia in high-fat-fed hamsters.Mol Nutr Food Res. 2011 Dec;55(12):1809-18. doi: 10.1002/mnfr.201100392. Epub 2011 Oct 31. Mol Nutr Food Res. 2011. PMID: 22038976
-
Berberine improves free-fatty-acid-induced insulin resistance in L6 myotubes through inhibiting peroxisome proliferator-activated receptor gamma and fatty acid transferase expressions.Metabolism. 2009 Dec;58(12):1694-702. doi: 10.1016/j.metabol.2009.06.009. Epub 2009 Sep 19. Metabolism. 2009. PMID: 19767038
-
Free fatty acids, insulin resistance, and pregnancy.Curr Diab Rep. 2003 Aug;3(4):319-22. doi: 10.1007/s11892-003-0024-y. Curr Diab Rep. 2003. PMID: 12866995 Review.
-
The Role of CD36 in Type 2 Diabetes Mellitus: β-Cell Dysfunction and Beyond.Diabetes Metab J. 2020 Apr;44(2):222-233. doi: 10.4093/dmj.2020.0053. Diabetes Metab J. 2020. PMID: 32347024 Free PMC article. Review.
Cited by
-
Aberrant activation of p53-TRIB3 axis contributes to diabetic myocardial insulin resistance and sulforaphane protection.J Adv Res. 2025 Jun;72:467-484. doi: 10.1016/j.jare.2024.07.025. Epub 2024 Jul 26. J Adv Res. 2025. PMID: 39069209 Free PMC article.
-
LncRNA-Mediated Adipogenesis in Different Adipocytes.Int J Mol Sci. 2022 Jul 5;23(13):7488. doi: 10.3390/ijms23137488. Int J Mol Sci. 2022. PMID: 35806493 Free PMC article. Review.
-
Antidiabetic and Anticancer Potentials of Mangifera indica L. from Different Geographical Origins.Pharmaceuticals (Basel). 2023 Feb 24;16(3):350. doi: 10.3390/ph16030350. Pharmaceuticals (Basel). 2023. PMID: 36986450 Free PMC article.
-
Virtual Screening and Biological Evaluation of Novel Low Molecular Weight Protein Tyrosine Phosphatase Inhibitor for the Treatment of Insulin Resistance.Drug Des Devel Ther. 2023 Apr 21;17:1191-1201. doi: 10.2147/DDDT.S406956. eCollection 2023. Drug Des Devel Ther. 2023. PMID: 37113468 Free PMC article.
-
Pharmacokinetic and metabolomic analyses of Mangiferin calcium salt in rat models of type 2 diabetes and non-alcoholic fatty liver disease.BMC Pharmacol Toxicol. 2020 Aug 6;21(1):59. doi: 10.1186/s40360-020-00438-x. BMC Pharmacol Toxicol. 2020. PMID: 32762728 Free PMC article.
References
MeSH terms
Substances
LinkOut - more resources
Full Text Sources
Miscellaneous
