. 2019 Feb 22;6(1):ENEURO.0300-18.2019.
doi: 10.1523/ENEURO.0300-18.2019. eCollection 2019 Jan-Feb.

Impaired Interneuron Development in a Novel Model of Neonatal Brain Injury

Affiliations

Impaired Interneuron Development in a Novel Model of Neonatal Brain Injury

Helene Lacaille et al. eNeuro. .

Abstract

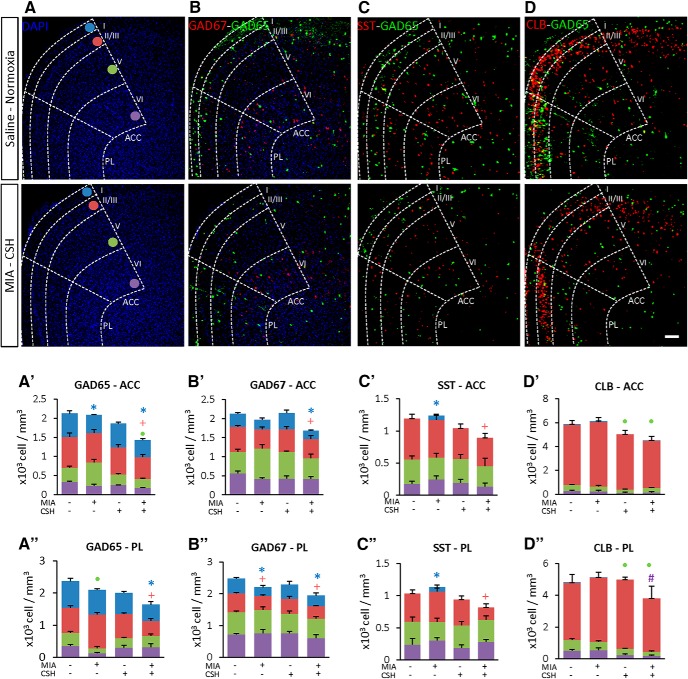
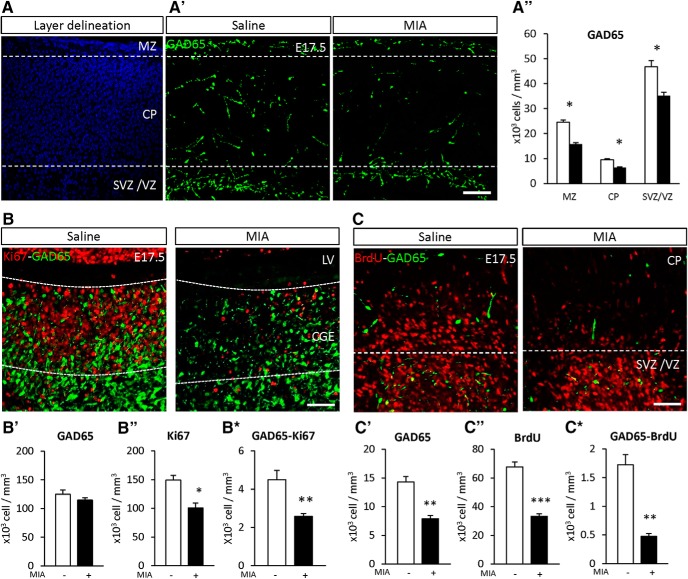
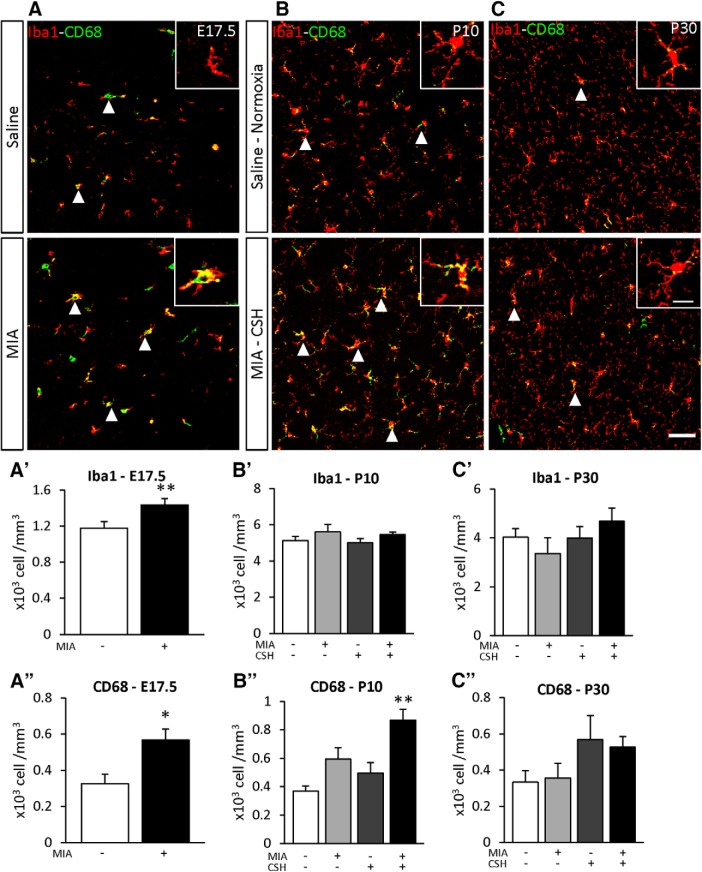
Prematurity is associated with significantly increased risk of neurobehavioral pathologies, including autism and schizophrenia. A common feature of these psychiatric disorders is prefrontal cortex (PFC) inhibitory circuit disruption due to GABAergic interneuron alteration. Cortical interneurons are generated and migrate throughout late gestation and early infancy, making them highly susceptible to perinatal insults such as preterm birth. Term and preterm PFC pathology specimens were assessed using immunohistochemical markers for interneurons. Based on the changes seen, a new preterm encephalopathy mouse model was developed to produce similar PFC interneuron loss. Maternal immune activation (MIA; modeling chorioamnionitis, associated with 85% of extremely preterm births) was combined with chronic sublethal hypoxia (CSH; modeling preterm respiratory failure), with offspring of both sexes assessed anatomically, molecularly and neurobehaviorally. In the PFC examined from the human preterm samples compared to matched term samples at corrected age, a decrease in somatostatin (SST) and calbindin (CLB) interneurons was seen in upper cortical layers. This pattern of interneuron loss in upper cortical layers was mimicked in the mouse PFC following the combination of MIA and CSH, but not after either insult alone. This persistent interneuron loss is associated with postnatal microglial activation that occurs during CSH only after MIA. The combined insults lead to long-term neurobehavioral deficits which parallel human psychopathologies that may be seen after extremely preterm birth. This new preclinical model supports a paradigm in which specific cellular alterations seen in preterm encephalopathy can be linked with a risk of neuropsychiatric sequela. Specific interneuron subtypes may provide therapeutic targets to prevent or ameliorate these neurodevelopmental risks.

Keywords: hypoxia; inflammation; interneurons; prematurity; psychiatric disorders.


Figures

Figure 1.
Figure 1.
Effect of prematurity on interneurons density in BA9 of male infants. Illustrations of (A) glutamate decarboxylase 65 and 67 (GAD65-67, green), (B) SST (red), (C) CLB (red), (D) CRT (red), and (E) NPY (red) interneurons density. Scale bar = 20 μm. Quantification of (A’) GAD65-67, (B’) SST, (C’) CLB, (D’) CRT, and (E’) NPY positive cells in the upper layers (ULs), lower layers (LLs) and subcortical white matter (SWM) of the BA9 of the frontal cortex of term and preterm male infants. BA9 of female infants are presented on Extended Data Figure 1-1. Interneuron-related protein expression and transcripts are presented in Extended Data Figures 1-2, 1-3, respectively. Scatter dot plots represent the mean and individual dispersion of seven to nine term (empty circles) and six to seven preterm infants (full circles); *p < 0.05 (two-way ANOVAs were performed followed by Fisher’s LSD tests for post hoc comparisons).
Figure 2.
Figure 2.
Effect of the multi-hit model on interneuron abundance and distribution in the anterior cingulate cortex (ACC) and prelimbic area (PL) of the PFC at P30. Illustration of (A) cortical layer delineation with DAPI (blue), the density and laminar distribution of GAD65 (green) overlaid with (B) GAD67, (C) SST, and (D) CLB (red) in the ACC and PL Layers I, II/III, V, and VI of mice treated with saline and reared under normoxia or subjected to MIA (injected with 150 μg/kg of LPS at E15.5 and E16.5) and reared under CSH. Scale bar = 100 μm. Five additional subtypes of interneuron were analyzed and are presented in Extended Data Figure 2-1. Quantification of interneurons (A’–D’) in the ACC and (A’’–D’’) in the PL of mice treated with saline and reared under normoxia, subjected to with MIA and reared under normoxia, treated with saline and reared under CSH and subjected to MIA and reared under CSH. Layers densities are stacked and blue, red, green, and purple colors are assigned for Layers I, II/III, V, and VI, respectively. Values represent the mean (±SEM) from five to six animals out two pregnancies. *, +, •, #p < 0.05 (Kruskal–Wallis with Dunn’s comparisons).
Figure 3.
Figure 3.
Effect of MIA at E17.5 on interneuron progenitor’s proliferation and fate. A, Delineation of the sub-regions of the embryonic cortex with DAPI (blue). A’, GAD65 density at E17.5 in the marginal zone (MZ), cortical plate (CP), and subventricular/ventricular zone (SVZ/VZ; green). Scale bar = 100 μm. A’’, Quantification of GAD65 positive cells in the MZ, CP, SVZ/VZ. B, GAD65 proliferation at E17.5 in the remaining CGE [density of GAD65 (green) and Ki67 (red)]. Scale bar = 50 μm. Proliferation in the other ganglionic eminence areas is presented in Extended Data Figure 3-1. Quantification of (B’) GAD65, (B’’) Ki67, and (B*) GAD65 and Ki67 co-labeled cells density in the CGE; (C) GAD65 cell fate in the cerebral cortex at E17.5 [GAD65 (green) and BrdU (red)] in mice subjected to saline or MIA (injected with 150 μg/kg of LPS at E15.5 and E16.5). Scale bar = 50 μm. Quantification of (C’) GAD65, (C’’) BrdU, and (C*) GAD65 and BrdU positive cells in the cerebral cortex of mice treated with saline (white bars) and subjected to MIA (black bars). Apoptotic cell death and total neuronal densities are presented in Extended Data Figures 3-2, 3-3, respectively. Values represent the mean (±SEM) from five to six animals out two pregnancies. A’, *p < 0.05 (two-way ANOVA with Sidak’s multiple comparisons); B, C, *p < 0.5, **p < 0.01, ***p < 001 (Mann–Whitney).
Figure 4.
Figure 4.
Effect of the multi-hit model on interneuron density and fate in the PFC at (A) P10 and (B) P30. GAD65 cell fate in the PFC [GAD65 (green) and BrdU (red)] of (A) mice treated with saline and reared under normoxia or subjected MIA and reared under CSH. Scale bar = 100 μm. Quantification of (A’) GAD65, (B’) GAD65 and BrdU co-labeled cell density of P10; and (A’’) GAD65, (B’’) GAD65 and BrdU co-labeled cell density at P30 in the PFC (ACC and PL are added for reference) treated with saline and reared under normoxia, subjected to with MIA and reared under normoxia, treated with saline and reared under CSH, subjected to MIA and reared under CSH. Values represent the mean (±SEM) from five to six animals out two pregnancies; *p < 0.05 (Kruskal–Wallis test with Dunn’s multiple comparisons).
Figure 5.
Figure 5.
Effect of the multi-hit model on GAD65 positive cells density at E17.5, P10, and P30 in the PFC of mice treated with saline and reared under normoxia, subjected to with MIA and reared under normoxia, treated with saline and reared under CSH, subjected to MIA and reared under CSH. Values represent the mean (±SEM) from at least seven animals out of at least two pregnancies; *p < 0.05; ***p < 0.001 (two-way ANOVA, Tukey’s multiple comparisons).
Figure 6.
Figure 6.
Effect of the multi-hit model on microglial density (Iba1) and activation (CD68) in the PFC at (A) E17.5 subjected to saline or MIA (injected with 150 μg/kg of LPS at E15.5 and E16.5), (B) P10, and (C) P30 mice treated with saline and reared under normoxia or subjected to MIA and reared under CSH. Arrowheads highlight cells positive for Iba1 and CD68. Scale bar = 50 μm. Scale bar of inset = 15 μm. Quantification of Iba1 at (A’) E17.5, (B’) P10, (C’) P30 and CD68, (A’’) E17.5, (B’’) P10, (C’’) P30 positive cells of mice treated with saline and reared under normoxia, subjected to with MIA and reared under normoxia, treated with saline and reared under CSH, subjected to MIA and reared under CSH. Values represent the mean (±SEM) from five to six animals out two pregnancies. A’, A’’, *p < 0.05; **p < 0.01 (Mann–Whitney); B’–C’’, **p < 0.01 (Kruskal–Wallis test with Dunn’s multiple comparisons).
Figure 7.
Figure 7.
Behavioral characterization. Assessment of working memory with spontaneous alternation in the Y-maze, mice were allowed to freely explore the maze for 10 min. A, Alternation index. Reinvestigation in the Barnes maze, mice were allowed to freely explore the maze for 10 min. B, Reinvestigation index. Assessment of learning and reversal learning in the water T-maze. Percentage of correct choice during (C) the learning phase (5 d) and (D) the reversal phase of the test (4 d). Assessment of social cognition in the three-chamber test. Percentage of time spent interacting between (E) a conspecific stranger (S1) versus an object; (F) a novel (S2) versus a familiar (S1) conspecific; (G) total time spent to interacting with conspecifics strangers of P30 mice treated with saline and reared under normoxia, subjected to with MIA (injected with 150 μg/kg of LPS at E15.5 and E16.5) and reared under normoxia, treated with saline and reared under CSH, subjected to MIA and reared under CSH. Complementary information is presented in Extended Data Figure 7-1. Values represent the mean (±SEM) from eight to twelve animals out of two pregnancies. A, B, E–G, *p < 0.05; **p < 0.01; ***p < 0.001 (one-way ANOVA with Holm–Sidak’s multiple comparisons); C, D, *p < 0.05; **p < 0.01; ***p < 0.001 (two-way ANOVA with Tukey’s multiple comparisons).

Similar articles

Cited by

References

    1. Adams-Chapman I, Stoll BJ (2006) Neonatal infection and long-term neurodevelopmental outcome in the preterm infant. Curr Opin Infect Dis 19:290–297. 10.1097/01.qco.0000224825.57976.87 - DOI - PubMed
    1. Arpino C, Compagnone E, Montanaro ML, Cacciatore D, De Luca A, Cerulli A, Di Girolamo S, Curatolo P (2010) Preterm birth and neurodevelopmental outcome: a review. Childs Nerv Syst 26:1139–1149. 10.1007/s00381-010-1125-y - DOI - PubMed
    1. Arshad A, Vose LR, Vinukonda G, Hu F, Yoshikawa K, Csiszar A, Brumberg JC, Ballabh P (2016) Extended production of cortical interneurons into the third trimester of human gestation. Cereb Cortex 26:2242–2256. 10.1093/cercor/bhv074 - DOI - PMC - PubMed
    1. Auger ML, Floresco SB (2014) Prefrontal cortical GABA modulation of spatial reference and working memory. Int J Neuropsychopharmacol 18:pyu013. 10.1093/ijnp/pyu013 - DOI - PMC - PubMed
    1. Bicks LK, Koike H, Akbarian S, Morishita H (2015) Prefrontal cortex and social cognition in mouse and man. Front Psychol 6:1805. 10.3389/fpsyg.2015.01805 - DOI - PMC - PubMed

Publication types