. 2019 May 7;47(8):4240-4254.
doi: 10.1093/nar/gkz129.

The moonlighting RNA-binding activity of cytosolic serine hydroxymethyltransferase contributes to control compartmentalization of serine metabolism

Affiliations

The moonlighting RNA-binding activity of cytosolic serine hydroxymethyltransferase contributes to control compartmentalization of serine metabolism

Giulia Guiducci et al. Nucleic Acids Res. .

Abstract

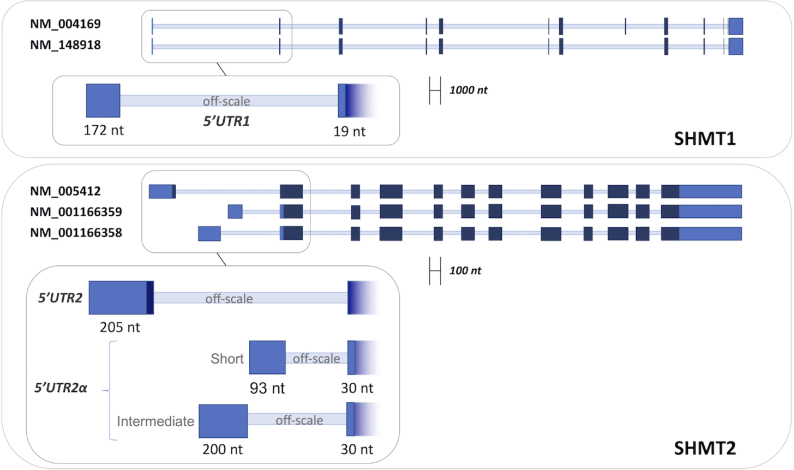
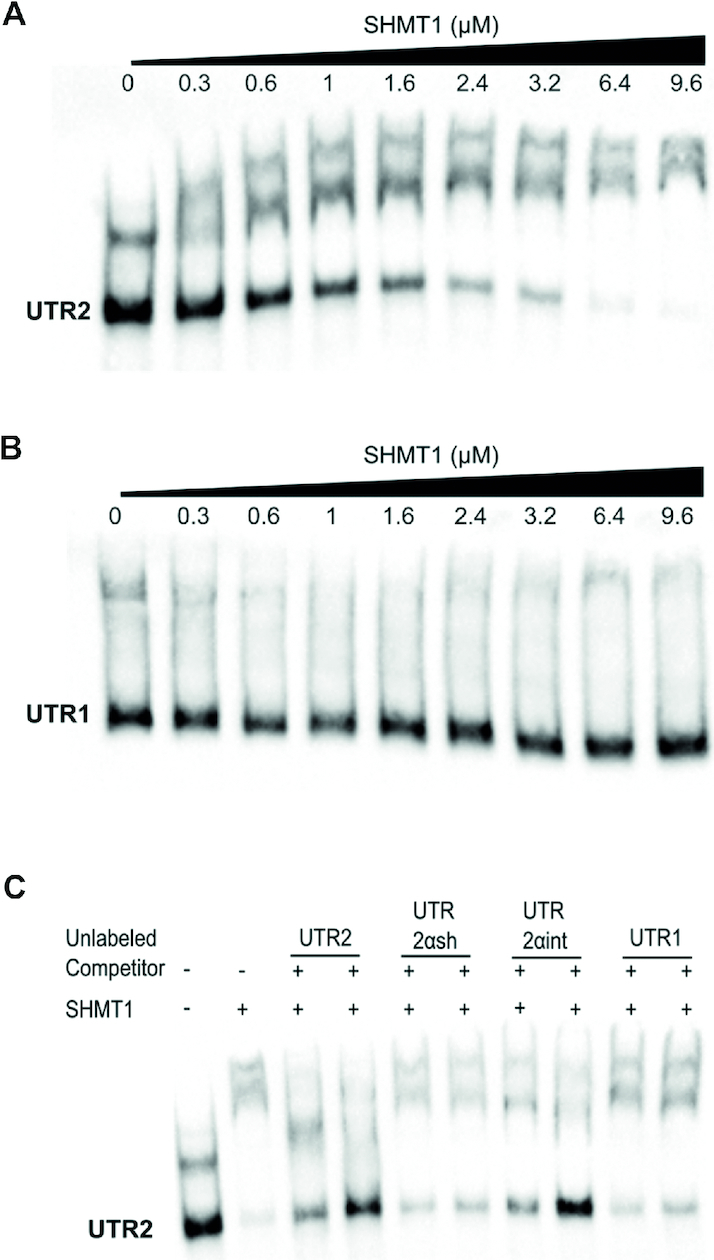
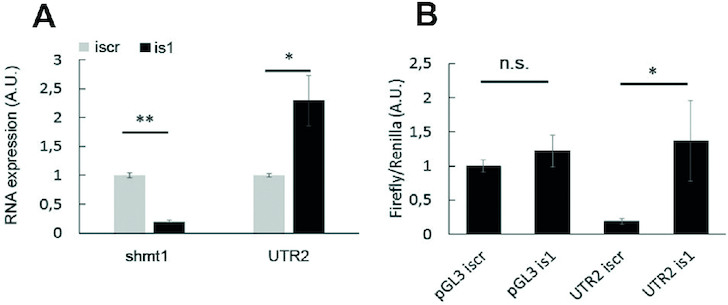
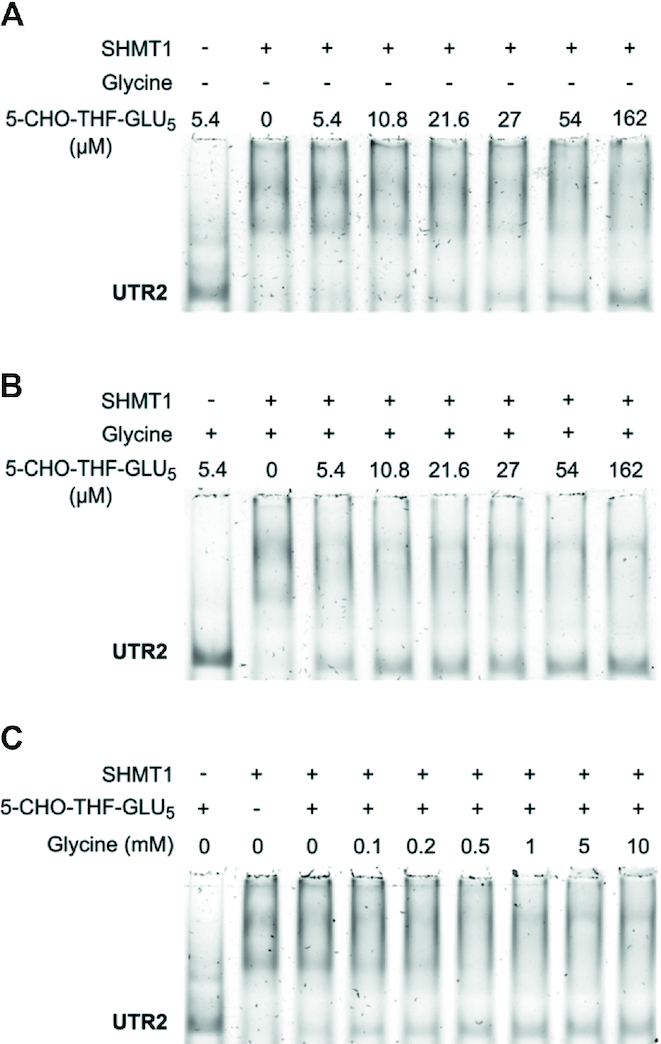
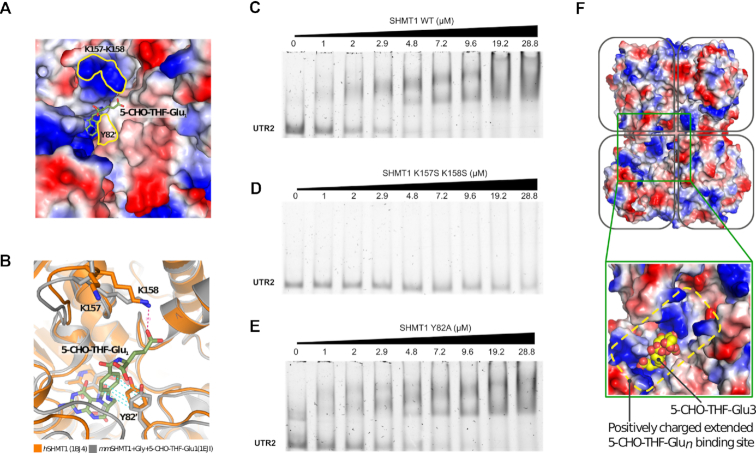
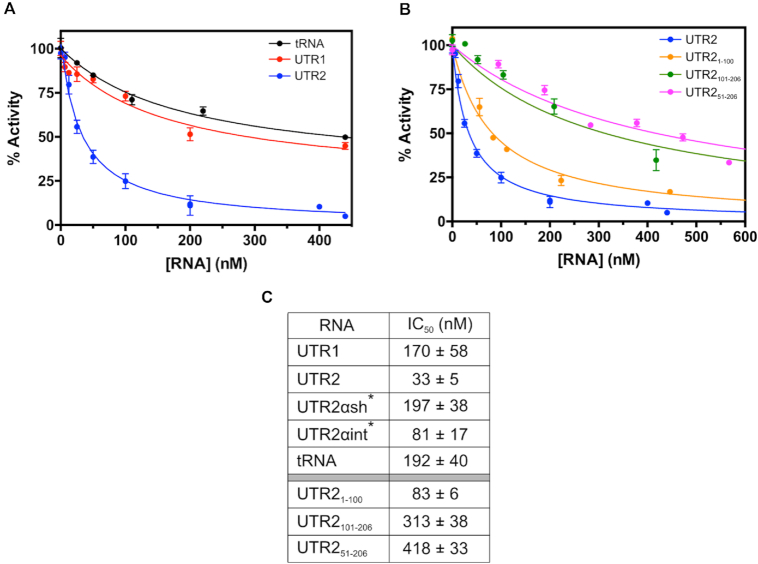
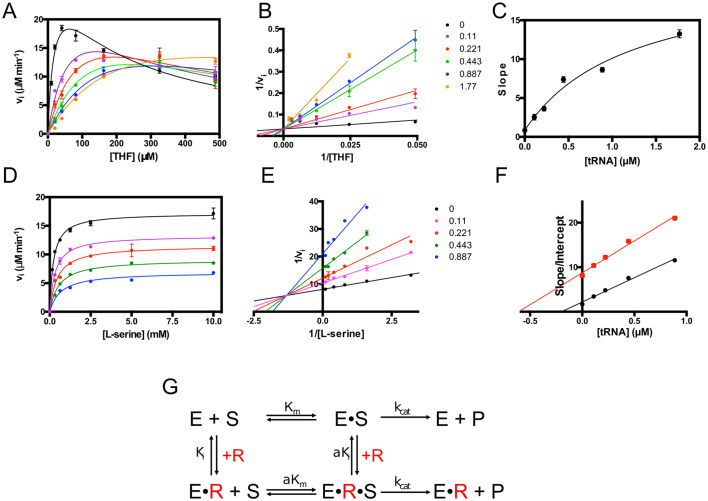
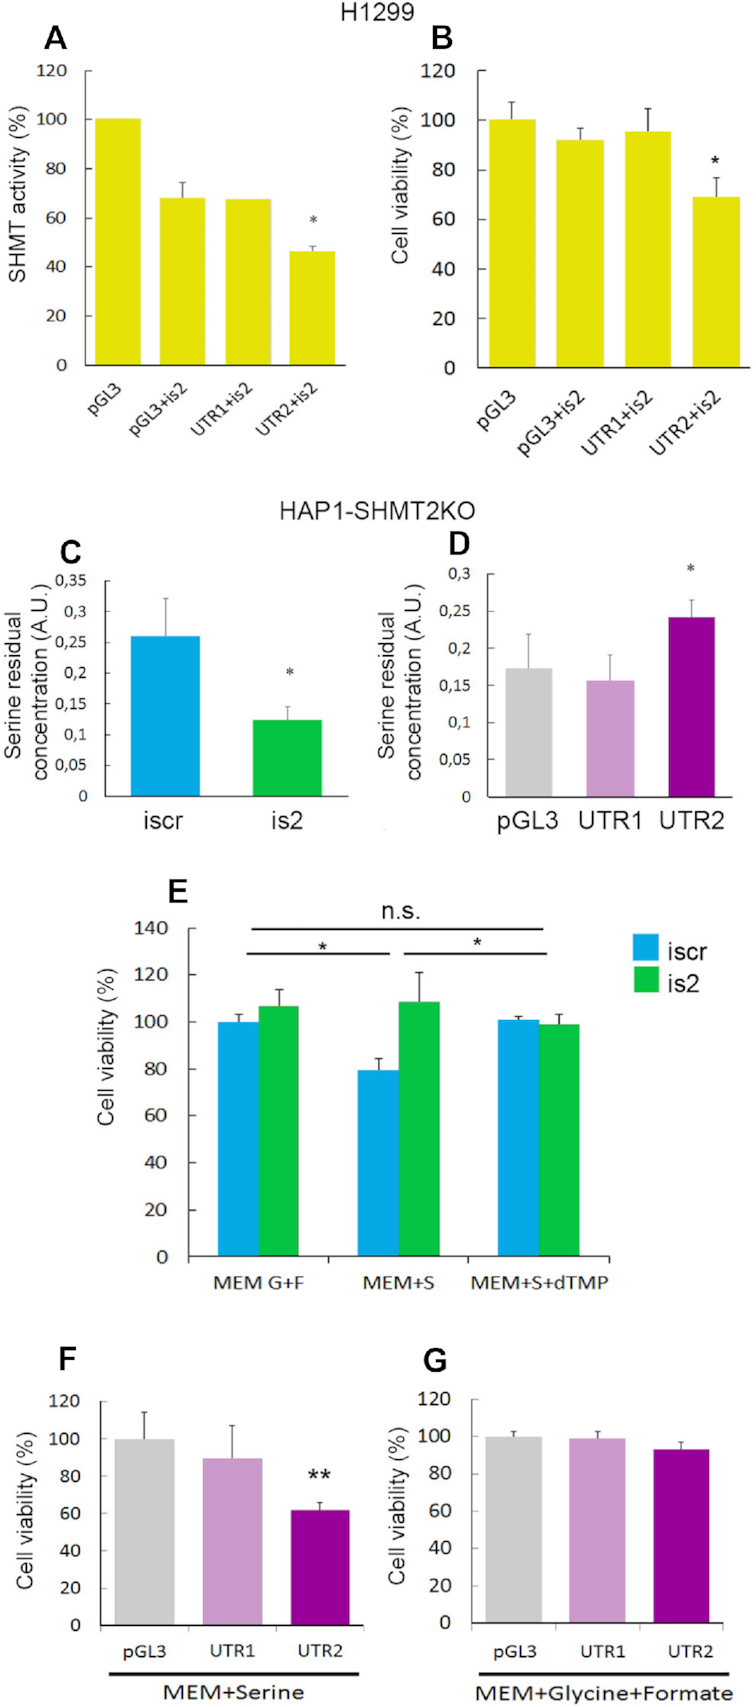
Enzymes of intermediary metabolism are often reported to have moonlighting functions as RNA-binding proteins and have regulatory roles beyond their primary activities. Human serine hydroxymethyltransferase (SHMT) is essential for the one-carbon metabolism, which sustains growth and proliferation in normal and tumour cells. Here, we characterize the RNA-binding function of cytosolic SHMT (SHMT1) in vitro and using cancer cell models. We show that SHMT1 controls the expression of its mitochondrial counterpart (SHMT2) by binding to the 5'untranslated region of the SHMT2 transcript (UTR2). Importantly, binding to RNA is modulated by metabolites in vitro and the formation of the SHMT1-UTR2 complex inhibits the serine cleavage activity of the SHMT1, without affecting the reverse reaction. Transfection of UTR2 in cancer cells controls SHMT1 activity and reduces cell viability. We propose a novel mechanism of SHMT regulation, which interconnects RNA and metabolites levels to control the cross-talk between cytosolic and mitochondrial compartments of serine metabolism.


Figures

Figure 1.
Figure 1.
Schematic representation of the pre-mRNAs of different SHMT1 and SHMT2 transcripts. Non-coding exons are colored in light blue, coding exons in dark blue and introns are represented as thin light blue lines. The 5′UTR sequences selected for the experiments, composed by the indicated exons, are shown in the inset. UTR1 = (NM_004169-NM148918: Ex1_21–192+Ex2_1–19). UTR2 = (NM005412:Ex1_1–205). UTR2αsh = (NM_001166359: Ex1_1–93+Ex2_1–30). UTR2αint = (NM_001166358: Ex1_1–200+Ex2_1–30).
Figure 2.
Figure 2.
Electrophoretic mobility shift assay. The first two panels show the migration of 0.08 μM biotin-labelled UTR2 (A) and UTR1 (B) alone or in the presence of the indicated concentrations of SHMT1 (3.75–125 fold excess SHMT1:RNA). (C) Competition assay performed by incubating 0.08 μM of biotin-labelled UTR2 with 4.8 μM SHMT1 and, respectively, 0.6 and 1.2 μM of unlabelled competitors (UTR2, UTR2αsh, UTR2αint and UTR1).
Figure 3.
Figure 3.
Global Score and omiXcore scores were linearly combined in the Combined Interaction Score to estimate the binding preference of SHMT1 to UTR2. The cumulative distribution function of the Combined Interaction Score of SHMT1 against 164 5′UTRs sequences with length of 206 nts is shown. The interaction affinity of SHMT1 against UTR2 is marked in red (top 2% of all cases).
Figure 4.
Figure 4.
(A) Effect of SHMT1 on UTR2 levels in H1299 lung cancer cells. Expression of shmt1 and UTR2 RNAs, measured 48 h after transfection with the iscramble (iscr) or ishmt1 (is1). (B) Effect of SHMT1 on the translation of UTR2-containing luciferase reporter mRNA in H1299 lung cancer cells. The panel shows the ratio between firefly and Renilla luciferase evaluated 24 h after transfection with the indicated plasmids (empty pGL3 or pGL3 containing UTR2) and the indicated RNAis. Reduction of SHMT1 by interference increases the amount of translation from UTR2-containing transcripts (UTR2 is1) with respect to control (UTR2 iscr). Statistical analysis is performed on three independent experiments. * P ≤ 0.05 ** P ≤ 0.01
Figure 5.
Figure 5.
Effect of SHMT substrates on the binding of UTR2. EMSA carried out by incubating 5.4 μM of SHMT1 with the indicated amounts of 5-CHO-THF-Glu5 in absence (A) or presence (B) of 10 mM glycine prior to the addition of 0.18 μM unlabelled UTR2. (C) Effects of glycine concentration on the folate-mediated displacement of UTR2. EMSA was performed incubating 5.4 μM of SHMT1 with the indicated amounts of glycine and a fixed concentration of 5-CHO-THF-Glu5 (27 μM) prior to the addition of 0.18 μM unlabelled UTR2.
Figure 6.
Figure 6.
SHMT1 amino acid residues involved in folate and RNA binding. (A) Surface representation of the folate-binding site of human SHMT1 (hSHMT, PDB id: 1BJ4 (53)) coloured by electrostatic potential (red are acidic and blue basic residues). The substrate (5-CHO-THF-Glu1) from mouse SHMT1 (mmSHMT1, PDB id: 1EJI (54)) is shown as sticks and superposed to the human enzyme. The location of K157, K158 and Y82′ is highlighted by the yellow contours. (B) Superposition of the human and mouse crystal structures (in orange and grey, respectively) showing the interaction of K158 and Y82′ with the folate substrate. (CE) EMSA assays carried out by incubating 0.24 μM of unlabelled UTR2 with the indicated concentrations of SHMT1 wild-type (WT) (C), K157S-K158S (D) and Y82A (E) mutants. The apparent dissociation constants (Kdapp) of the protein–UTR2 complexes were measured for the WT and for the Y82A mutant, and are respectively 1.39 ± 0.30 μM and 3.0 ± 0.68 μM. The Kdapp value for the K157S-K158S SHMT1 mutant cannot be calculated given the low affinity of this protein for the UTR2 RNA in the concentration range explored. (F) Surface charge distribution of the human SHMT1 tetramer (PDB id: 1BJ4 (53)). In the blow up, 5-CHO-THF-Glu3, as observed in complex with rabbit SHMT1 (PDB id: 1LS3 (31)), is shown as yellow spheres superposed to the human enzyme. In the rabbit structure, the 5-CHO-THF-Glu3 is bound to two subunits (0.5 stoichiometry), with the poly-glutamylated tail making extensive and non-specific electrostatic interactions with the positively charged residues that surround the folate binding cleft.
Figure 7.
Figure 7.
Inactivation of SHMT1 by RNA followed by measuring the initial velocity of the hydroxymethyltransferase reaction using L-serine and THF as substrates. (A) Inactivation of SHMT1 by three different RNAs, UTR1 (in red), UTR2 (in blue) and tRNA (in black) is reported. (B) Inactivation of SHMT1 by three UTR2 segments, namely UTR21–100 (in orange), UTR2101–206 (in green) and UTR251–206 (in pink). All the experimental data, acquired in three independent experiments, were fitted to Equation (2) (see ‘Materials and Methods’ section), obtaining the continuous lines shown in the figures; the corresponding IC50 values are reported in (C). *The experimental curves for the UTR2αsh and UTR2αint are reported in Supplementary Figure S5.
Figure 8.
Figure 8.
Mechanism of inhibition of SHMT1 catalysis by RNA. (A) Initial velocity of the SHMT reaction was measured at different THF concentrations, in the presence of saturating L-serine (10 mM) and fixed concentrations of tRNA: 0, 0.11, 0.22, 0.44, 0.88 and 1.77 μM. The continuous lines through the experimental points (which are the average of three independent experiments) are those obtained upon the least square fitting of data to Equation (3) (see ‘Materials and Methods’ section). (B) Double reciprocal plots of experimental points from A, after exclusion of the substrate inhibition portion of data. The continuous straight lines through the experimental points were obtained from the independent linear fitting of data. (C) Dependence of the slope, calculated in double reciprocal plot (B), on tRNA concentration. The continuous line through the experimental points was obtained from fitting to a saturation curve. (D) Initial velocity of the SHMT reaction was measured at different L-serine concentrations, in the presence of 80 μM THF and fixed concentrations of tRNA: 0, 0.11, 0.22, 0.44, 0.88 and 1.77 μM. The continuous lines through the experimental points (average of three independent experiments) are those obtained upon the least square fitting of data to Michaelis–Menten equation. (E) Double reciprocal plots of experimental points from D. The continuous straight lines through the experimental points were obtained from the independent linear fitting of data. (F) Replots of data taken from the double reciprocal plot (E): slope (Km/Vmax; in black) and intercept (1/Vmax; in red) versus tRNA concentration. The continuous straight lines through the experimental points were obtained from linear fitting. (G) Equilibria describing hyperbolic competitive inhibition between SHMT1 and RNA (data shown in panels A–C). In this particular case, a saturating amino acid substrate concentration (either L-serine or glycine) is present and therefore E corresponds to the enzyme–amino acid complex. E•S is the ternary complex with the folate substrate (either THF or CH2THF). If RNA (R) is present, it binds to both E and E•S forming E•R and E•R•S complexes, respectively.
Figure 9.
Figure 9.
SHMT activity and cell viability in H1299 and HAP1-SHMT2KO cells. (A) SHMT enzymatic activity in H1299 cells 48 h after transfection with the indicated plasmids (pGL3 alone or with UTR1 and UTR2, respectively) and iRNAs measured by tritium-exchange radioisotopic assay. (B) Cell viability evaluated by Trypan blue exclusion assay in H1299 cells cultured in MEM supplemented for 24 h with 0.4 mM serine the day after transfection with the indicated iRNAs and/or plasmids. SHMT1 activity in HAP1-SHMT2KO cells assessed evaluating serine residual concentration in the supernatants 72 h after transfection with the indicated RNAis (C) or plasmids (D). (E) Cell viability evaluated in HAP1-SHMT2KO cells cultured in MEM supplemented for 48 h with 0.4 mM glycine (G) + 0.5 mM formate (F), 0.4 mM serine (S) and/or 30 μM thymidine 5′monophosphate (dTMP) the day after transfection with the indicated RNAis (E) or plasmids (F and G). Statistical analysis are performed on three independent experiments * P ≤ 0.05.

Similar articles

Cited by

References

    1. Castello A., Hentze M.W., Preiss T.. Metabolic enzymes enjoying new partnerships as RNA-Binding proteins. Trends Endocrinol. Metab. 2015; 26:746–757. - PMC - PubMed
    1. Liu J., Schmitz J.C., Lin X., Tai N., Yan W., Farrell M., Bailly M., Chen T.M., Chu E.. Thymidylate synthase as a translational regulator of cellular gene expression. Biochim. Biophys. Acta. 2002; 1587:174–182. - PubMed
    1. Tai N., Ding Y., Schmitz J.C., Chu E.. Identification of critical amino acid residues on human dihydrofolate reductase protein that mediate RNA recognition. Nucleic Acids Res. 2002; 30:4481–4488. - PMC - PubMed
    1. Chang C.-H., Curtis J.D., Maggi L.B., Faubert B., Villarino A.V., O’Sullivan D., Huang S.C.-C., van der Windt G.J.W., Blagih J., Qiu J. et al. .. Posttranscriptional control of T cell effector function by aerobic glycolysis. Cell. 2013; 153:1239–1251. - PMC - PubMed
    1. Ducker G.S., Chen L., Morscher R.J., Ghergurovich J.M., Esposito M., Teng X., Kang Y., Rabinowitz J.D.. Reversal of cytosolic one-carbon flux compensates for loss of the mitochondrial folate pathway. Cell Metab. 2016; 23:1140–1153. - PMC - PubMed

Publication types

MeSH terms