. 2019 Jun;98(6):1145-1156.
doi: 10.1111/tpj.14297. Epub 2019 Apr 6.

MyROOT: a method and software for the semiautomatic measurement of primary root length in Arabidopsis seedlings

Affiliations

MyROOT: a method and software for the semiautomatic measurement of primary root length in Arabidopsis seedlings

Isabel Betegón-Putze et al. Plant J. 2019 Jun.

Abstract

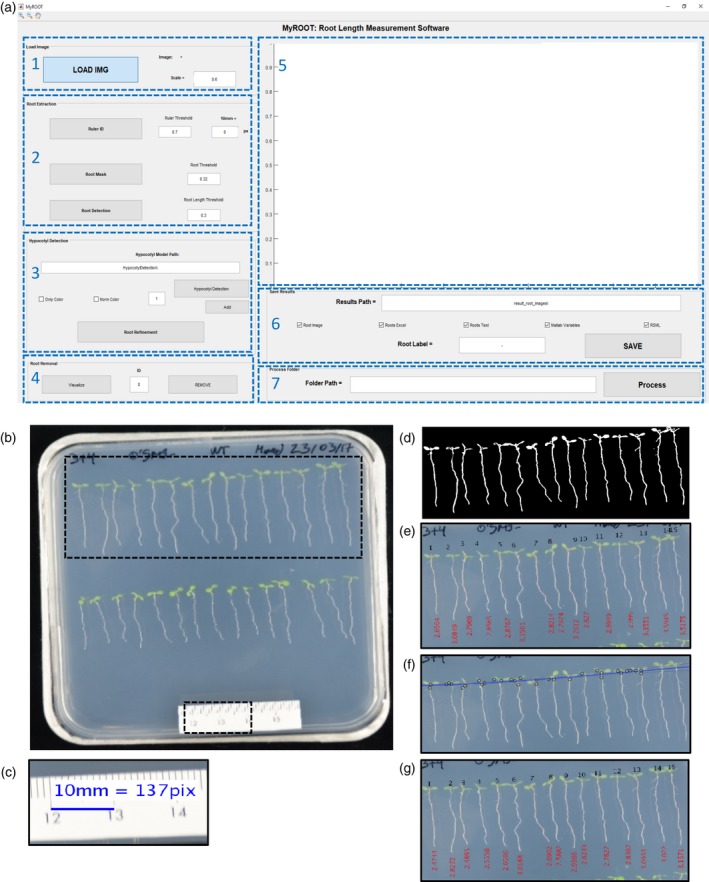
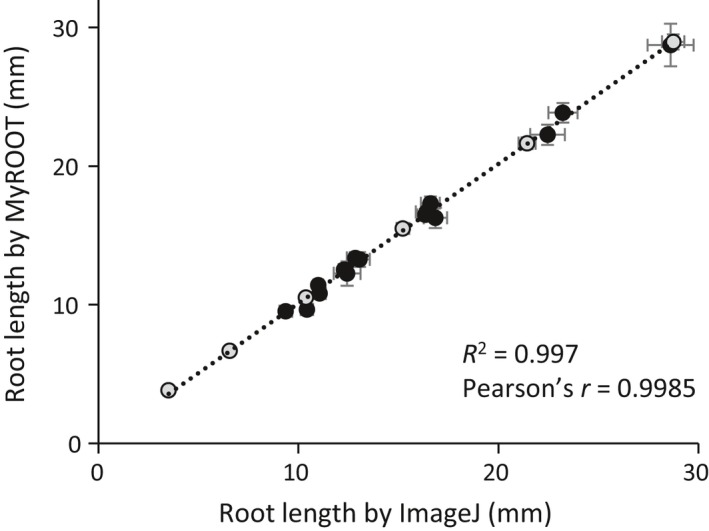
Root analysis is essential for both academic and agricultural research. Despite the great advances in root phenotyping and imaging, calculating root length is still performed manually and involves considerable amounts of labor and time. To overcome these limitations, we developed MyROOT, a software for the semiautomatic quantification of root growth of seedlings growing directly on agar plates. Our method automatically determines the scale from the image of the plate, and subsequently measures the root length of the individual plants. To this aim, MyROOT combines a bottom-up root tracking approach with a hypocotyl detection algorithm. At the same time as providing accurate root measurements, MyROOT also significantly minimizes the user intervention required during the process. Using Arabidopsis, we tested MyROOT with seedlings from different growth stages and experimental conditions. When comparing the data obtained from this software with that of manual root measurements, we found a high correlation between both methods (R2 = 0.997). When compared with previous developed software with similar features (BRAT and EZ-Rhizo), MyROOT offered an improved accuracy for root length measurements. Therefore, MyROOT will be of great use to the plant science community by permitting high-throughput root length measurements while saving both labor and time.

Keywords: Arabidopsis thaliana; high-throughput image analysis; root length; root phenotyping; software; technical advance.


Conflict of interest statement

The authors declare no conflicts of interest.

Figures

Figure 1
Figure 1
The graphical interface and steps of MyROOT. (a) The graphical user interface of MyROOT is organized into seven sections: 1. Input image information, 2. Root extraction parameters, 3. Hypocotyl detection parameters, 4. Manual removal of roots, 5. Visualization of the image and the different detection steps, 6. Saving parameters, and 7. Batch processing (b) The input image required for analysis is a picture of the square plate in which the aligned seedlings are growing. By using information from this image, MyROOT performs the following steps: (c) Identification of the ruler to determine the scale (i.e., the equivalence between pixels and millimeters). (d) Root segmentation to identify the seedlings. (e) Root tracking to measure the roots. (f) Hypocotyl detection to identify the hypocotyls and separate them from the roots. (g) Root measurement to quantify the length of individual seedlings (i.e., the distance from the root tip to the end of the hypocotyl).
Figure 2
Figure 2
Root extraction method. (a) Colors are normalized in the area where roots are present, and white roots are detected. (b) Segmentation is performed by applying a ridge detector. (c) Starting at the root tip, the roots are tracked using a bottom‐up approach. (d) Each root is measured using its historical recorded tracking, and root length is calculated by taking into account the pixel‐millimeter equivalence.
Figure 3
Figure 3
Validation of root length measurements. Correlation of root length measurements using MyROOT (y axis) and ImageJ (x axis). Each point corresponds to a different experiment (n > 20 in each one): time course data from 3 DAG to 8 DAG seedlings (grey) and BR‐related mutants in control and osmotic stress conditions (black, Fabregas et al., 2018). Errors bars indicate the standard error. For the time course experiment, seedlings that were not measured by MyROOT in at least four time points were discarded.
Figure 4
Figure 4
Hypocotyl detection method and validation. (a) Scheme of the hypocotyl detection method. A candidate window is defined as a square area inside the image. To describe a candidate, appearance/shape (HOG) and color information are extracted. Appearance information is extracted to calculate the gradient of the image (i.e., the direction of the contours within the image at each pixel). Histograms of Oriented Gradient (HOG) and the histograms of color are calculated over regular spaced, non‐overlapping cells inside the candidate window (forming the block descriptor). Finally, all color/HOG cell histograms are concatenated to obtain the candidate window description. (b) Precision‐Recall curve for three different models of hypocotyl detection (HOG, Color and HOG + Color). The curve is obtained by changing the threshold that defines the frontier between positive and negative samples. For each threshold, the precision (well classified ratio) and the recall (poor classified ratio) were calculated. The area under the curve represents the robustness of the classifier, with a higher value indicating greater robustness (a higher well classified ratio to poor classified ratio over the entire range of the classifier). (c) False Positives Per Image (FPPI) curve for three different models of hypocotyl detection (HOG, Color and HOG+Color). The curve plots the miss rate against the FPPI. In this way, the average miss rate over a specific FPPI range (1–10) represents the sensitivity of the classifier to not miss good samples and keep the false positive ratio low. (d) The average distance in pixels between the real hypocotyl position and the point of intersection between the root and the polynomial regression curves, for polynomial regression curves of orders 1–6 and an extra model including a sine component. Error bars indicate the standard error.
Figure 5
Figure 5
Evaluation of hypocotyl detection method for the root length measurements using MyROOT. (a–d) Qualitative analysis of the hypocotyl detection method in two different images. (e) Root length measurement of seedling grown in two different plates (showed in (a–d)) using and not using the hypocotyl detection method. Different letters indicate statistically significant differences (P‐value <0.05; Student's t‐test, n > 30).

References

    1. Armengaud, P. , Zambaux, K. , Hills, A. , Sulpice, R. , Pattison, R.J. , Blatt, M.R. and Amtmann, A. (2009) EZ‐Rhizo: integrated software for the fast and accurate measurement of root system architecture. Plant J. 57, 945–956. - PubMed
    1. Arsenault, J. , Poulcur, S. , Messier, C. and Guay, R. (1995) Winrhizo: a root measuring system with a unique overlap correction method. HortScience, 30, 906.
    1. Beemster, G.T. and Baskin, T.I. (1998) Analysis of cell division and elongation underlying the developmental acceleration of root growth in Arabidopsis thaliana. Plant Physiol. 116, 1515–1526. - PMC - PubMed
    1. Benfey, P.N. , Linstead, P.J. , Roberts, K. , Schiefelbein, J.W. , Hauser, M.T. and Aeschbacher, R.A. (1993) Root development in Arabidopsis: four mutants with dramatically altered root morphogenesis. Development, 119, 57–70. - PubMed
    1. van den Berg, C. , Willemsen, V. , Hendriks, G. , Weisbeek, P. and Scheres, B. (1997) Short‐range control of cell differentiation in the Arabidopsis root meristem. Nature, 390, 287–289. - PubMed

Publication types