. 2019 Apr 9;15(4):2127-2141.
doi: 10.1021/acs.jctc.8b01255. Epub 2019 Mar 13.

Automated Multiscale Approach To Predict Self-Diffusion from a Potential Energy Field

Affiliations

Automated Multiscale Approach To Predict Self-Diffusion from a Potential Energy Field

Amber Mace et al. J Chem Theory Comput. .

Abstract

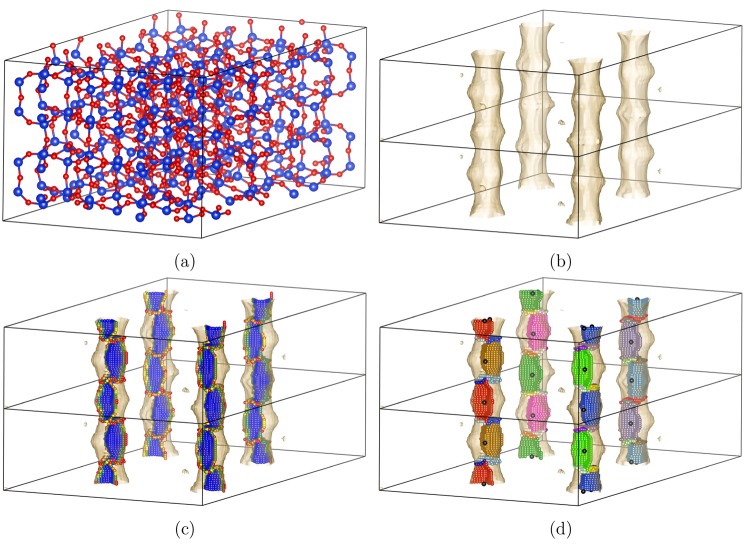
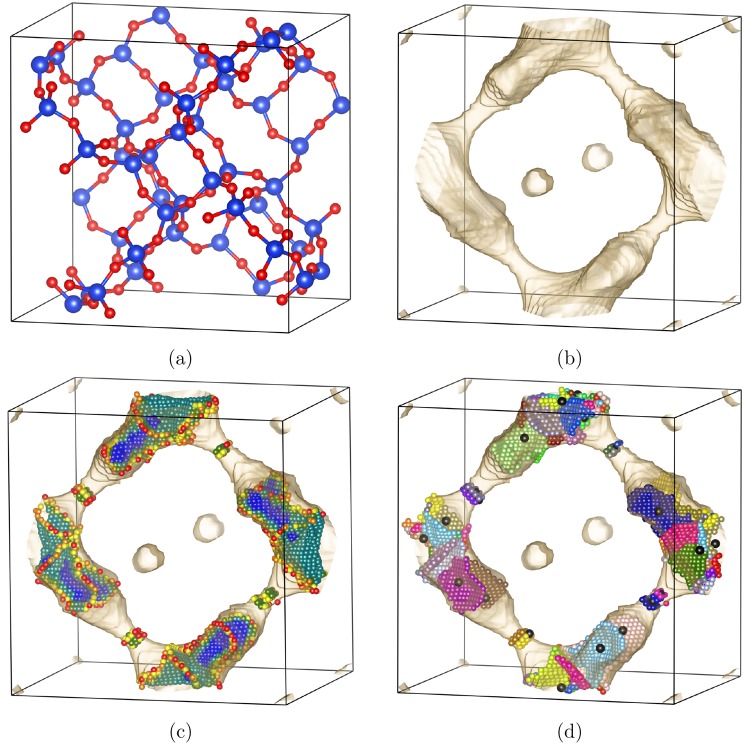
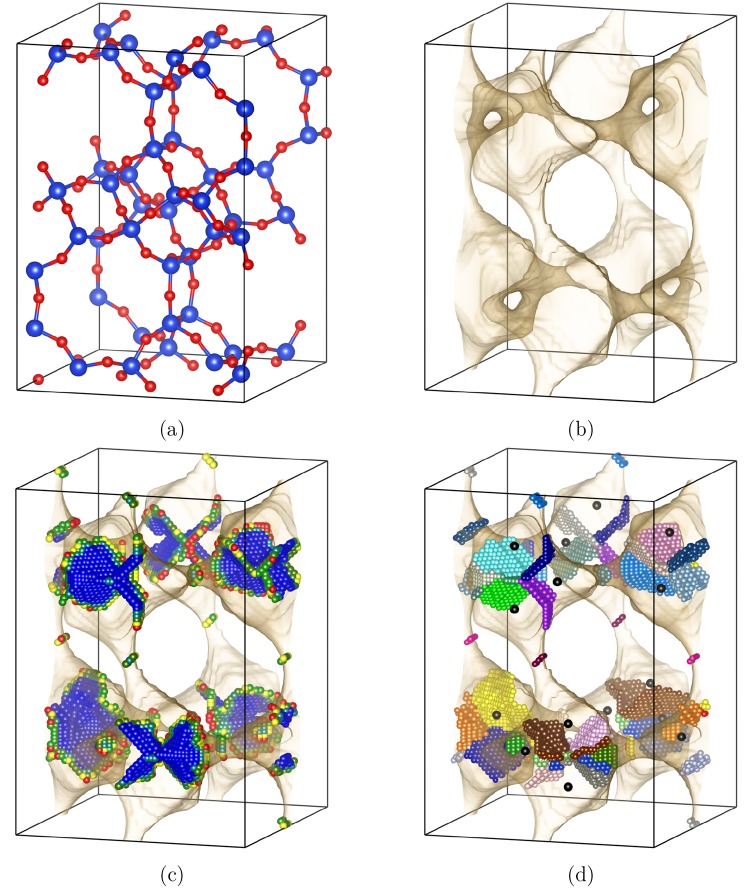
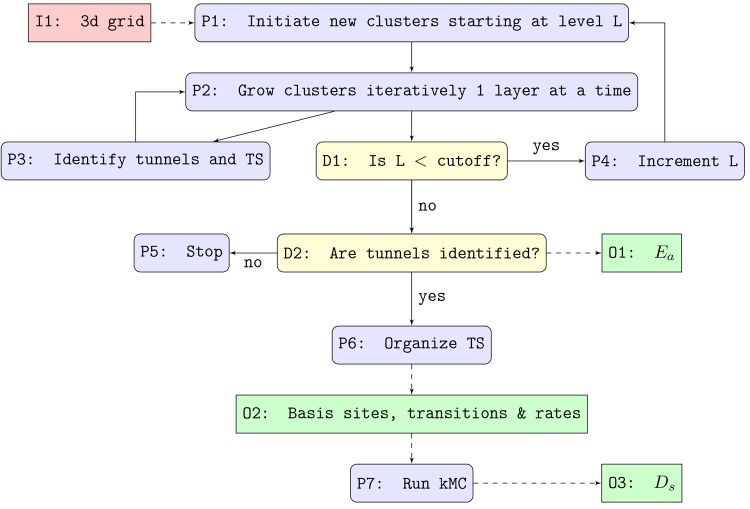
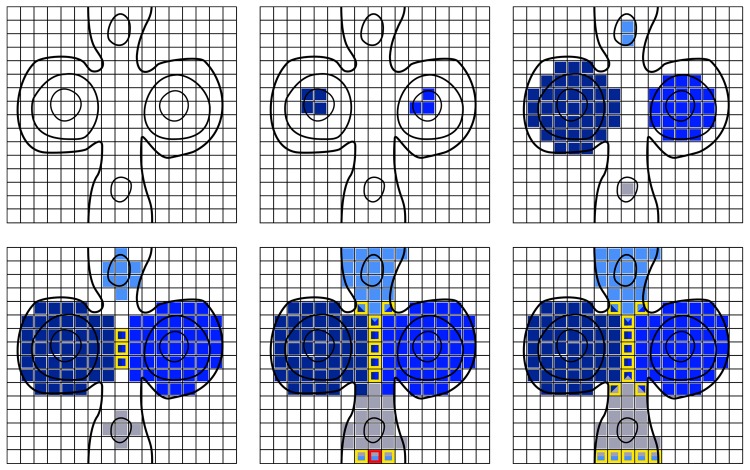
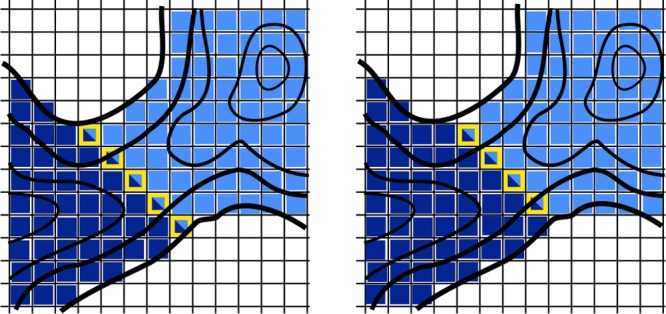
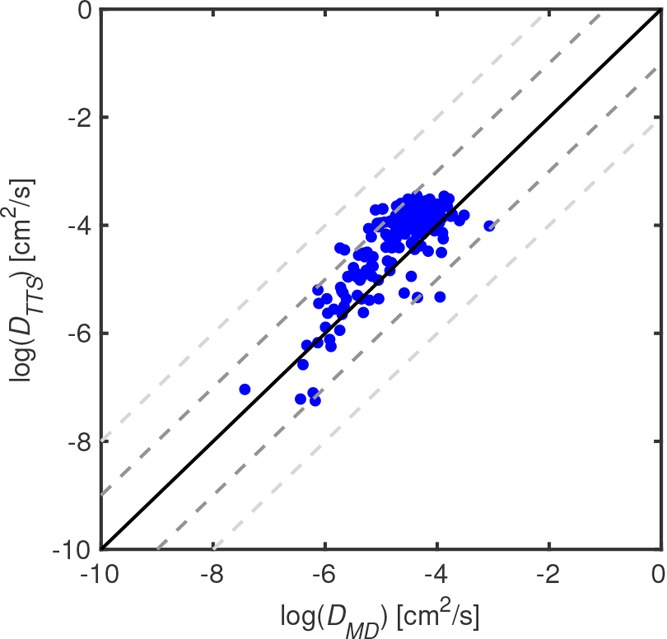
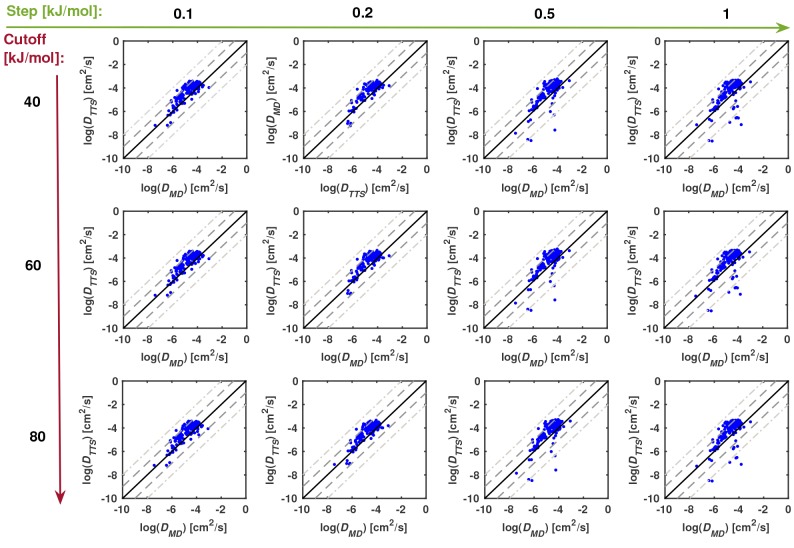
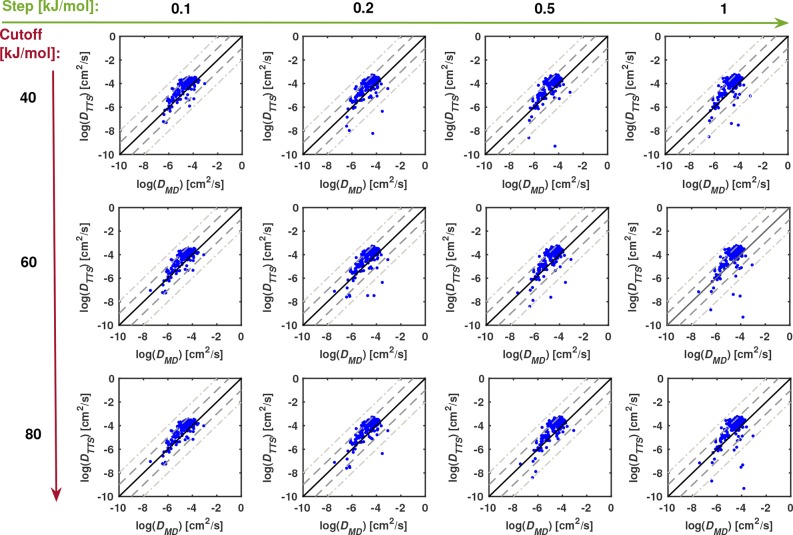
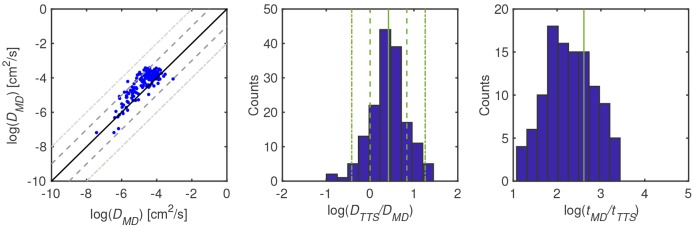
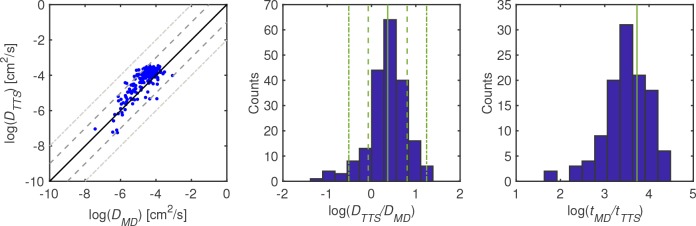
For large-scale screening studies there is a need to estimate the diffusion of gas molecules in nanoporous materials more efficiently than (brute force) molecular dynamics. In particular for systems with low diffusion coefficients molecular dynamics can be prohibitively expensive. An alternative is to compute the hopping rates between adsorption sites using transition state theory. For large-scale screening this requires the automatic detection of the transition states between the adsorption sites along the different diffusion paths. Here an algorithm is presented that analyzes energy grids for the moving particles. It detects the energies at which diffusion paths are formed, together with their directions. This allows for easy identification of nondiffusive systems. For diffusive systems, it partitions the grid coordinates assigned to energy basins and transitions states, permitting a transition state theory based analysis of the diffusion. We test our method on CH4 diffusion in zeolites, using a standard kinetic Monte Carlo simulation based on the output of our grid analysis. We find that it is accurate, fast, and rigorous without limitations to the geometries of the diffusion tunnels or transition states.


Conflict of interest statement

The authors declare no competing financial interest.

Figures

Figure 1
Figure 1
(a) A 2 × 1 × 1 supercell of the IZA structure framework of PSI (blue = Si and red = O atoms). (b) The isosurface of the potential energy at 60 kJ/mol, which defines the accessible pore volume, shows that PSI has a one-dimensional tunnel system accessible to CH4. (c) The TSs of the one-dimensional CH4 diffusion are colored by energy levels (blue = low to red = high). (d) The independent TS surfaces dividing basin pairs are colored differently; the black points show the positions that represent the lattice sites used in the kMC simulation.
Figure 2
Figure 2
(a) One unit cell of the IZA structure framework of IFY (blue = Si and red = O atoms). (b) The isosurface of the potential energy at 60 kJ/mol shows that IFY has a two-dimensional tunnel system accessible to CH4. The isolated spherical cavities are inaccessible from the outside and therefore do not play a role in the diffusion. (c) The TSs of the two-dimensional CH4 diffusion are colored by energy levels (blue = low to red = high). (d) The independent TS surfaces dividing basin pairs are colored differently; the black points show the positions that represent the lattice sites used in the kMC simulation.
Figure 3
Figure 3
(a) One unit cell of the IZA structure framework of AEI (blue = Si and red = O atoms). (b) The isosurface of the potential energy at 60 kJ/mol shows that AEI has a three-dimensional tunnel system accessible to CH4. (c) The TSs of the three-dimensional CH4 diffusion are colored by energy levels (blue = low to red = high). (d) The independent TS surfaces dividing basin pairs are colored differently; the black points show the positions that represent the lattice sites used in the kMC simulation.
Figure 4
Figure 4
Schematic outline of the TuTraSt algorithm where the boxes are colored by red = input (I1), green = output (O1–O3), blue = processes (P1–P7), yellow = decisions (D1–D2).
Figure 5
Figure 5
Growth of basins with tunnel and TS identification. The clusters are grown in the order: left, right, top, bottom. A tunnel is detected in the middle figure of the bottom line (red). Points belonging to TSs are indicated with yellow boundaries.
Figure 6
Figure 6
Illustration of the dependency of the position of the TSs on the order in which the basins are grown. No periodic boundary conditions are applied in this figure.
Figure 7
Figure 7
Directional diffusion coefficients computed with the TuTraSt algorithm with optimized energetic parameters (gres = 0.2 Å, Ecutoff = 60 kJ/mol, and Estep = 0.1 kJ/mol) on the y-axis relative to the corresponding diffusion coefficients computed with MD on the x-axis on a log–log scale for DS5. The solid black line represents a perfect correspondence between the data sets, while the light gray and dark gray dashed lines guide the limits for deviation of 1 and 2 orders of magnitude, respectively.
Figure 8
Figure 8
Comparing the DTTS and DMD for all IZA zeolites, using grids with grid size 0.1 Å. The plots differ by the choice of the values of Ecutoff and Estep.
Figure 9
Figure 9
Comparing the DTTS and DMD for all IZA zeolites, using grids with grid size 0.2 Å. The plots differ by the choice of the values of Ecutoff and Estep.
Figure 10
Figure 10
For DS2 the energetic parameters are gres = 0.1 Å, Ecutoff = 60 kJ/mol, and Estep = 0.1 kJ/mol. The left panel shows the directional diffusion coefficients computed with the TuTraSt algorithm on the y-axis relative to the corresponding diffusion coefficients computed with MD on the x-axis on a log–log scale. The solid black line represents a perfect correspondence between the data sets, while the light gray and dark gray dashed lines guide the limits for deviation of 1 and 2 orders of magnitude, respectively. The center panel shows a histogram of the log-scale deviation from the MD validation set. Here the solid green line shows the ϵ = 0.42, and the dashed green lines show 1 (−) and 2 (.-) × σ = 0.42. The right panel shows a histogram of the log-scale speedup of a TuTraSt calculation per structure relative to the corresponding MD calculation. The green solid line shows the mean speedup of 409 for DS2.
Figure 11
Figure 11
For DS5 the energetic parameters are gres = 0.2 Å, Ecutoff = 60 kJ/mol, and Estep = 0.1 kJ/mol. The left panel shows the directional diffusion coefficients computed with the TuTraSt algorithm on the y-axis relative to the corresponding diffusion coefficients computed with MD on the x-axis on a log–log scale. The solid black line represents a perfect correspondence between the data sets, while the light gray and dark gray dashed lines guide the limits for deviation of 1 and 2 orders of magnitude, respectively. The center panel shows a histogram of the log-scale deviation from the MD validation set. Here the solid green line shows the ϵ = 0.37, and the dashed green lines show 1 (−) and 2 (.-) × σ = 0.43. The right panel shows a histogram of the log-scale speedup of a TuTraSt calculation per structure relative to the corresponding MD calculation. The green solid line shows the mean speedup of 5345 for DS5.

References

    1. Koros W. J.; Zhang C. Materials for next-generation molecularly selective synthetic membranes. Nat. Mater. 2017, 16, 289–297. 10.1038/nmat4805. - DOI - PubMed
    1. Sholl D. S.; Lively R. P. Seven chemical separations to change the world. Nature 2016, 532, 435–437. 10.1038/532435a. - DOI - PubMed
    1. Kim J.; Abouelnasr M.; Lin L.-C.; Smit B. Large-Scale Screening of Zeolite Structures for CO2Membrane Separations. J. Am. Chem. Soc. 2013, 135, 7545–7552. PMID: 2365421710.1021/ja400267g. - DOI - PubMed
    1. Daglar H.; Keskin S. Computational Screening of Metal-Organic Frameworks for Membrane-Based CO2/N2/H2O Separations: Best Materials for Flue Gas Separation. J. Phys. Chem. C 2018, 122, 17347–17357. 10.1021/acs.jpcc.8b05416. - DOI - PMC - PubMed
    1. Qiao Z.; Xu Q.; Jiang J. High-throughput computational screening of metal-organic framework membranes for upgrading of natural gas. J. Membr. Sci. 2018, 551, 47–54. 10.1016/j.memsci.2018.01.020. - DOI