. 2019 Feb 27;15(2):e1007941.
doi: 10.1371/journal.pgen.1007941. eCollection 2019 Feb.

Endothelin receptor Aa regulates proliferation and differentiation of Erb-dependent pigment progenitors in zebrafish

Affiliations

Endothelin receptor Aa regulates proliferation and differentiation of Erb-dependent pigment progenitors in zebrafish

Karen Camargo-Sosa et al. PLoS Genet. .

Abstract

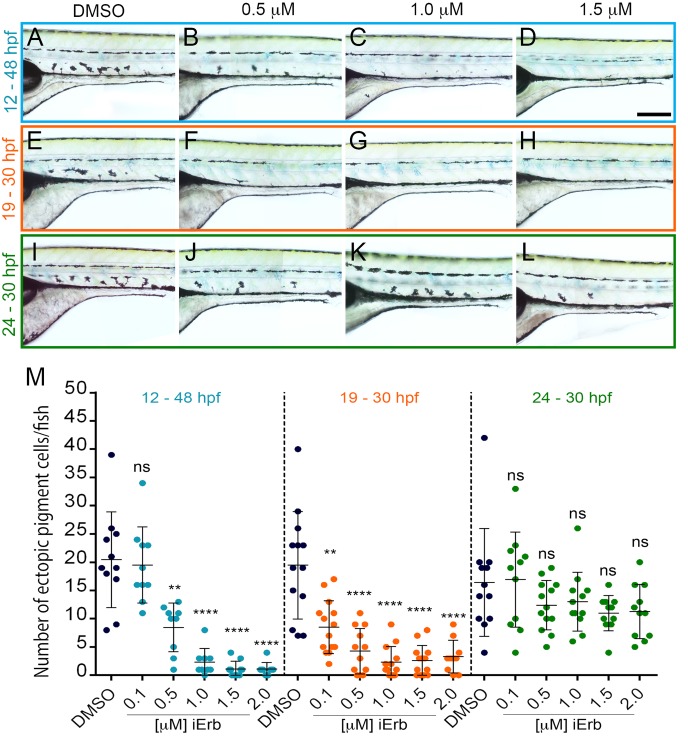
Skin pigment patterns are important, being under strong selection for multiple roles including camouflage and UV protection. Pigment cells underlying these patterns form from adult pigment stem cells (APSCs). In zebrafish, APSCs derive from embryonic neural crest cells, but sit dormant until activated to produce pigment cells during metamorphosis. The APSCs are set-aside in an ErbB signaling dependent manner, but the mechanism maintaining quiescence until metamorphosis remains unknown. Mutants for a pigment pattern gene, parade, exhibit ectopic pigment cells localised to the ventral trunk, but also supernumerary cells restricted to the Ventral Stripe. Contrary to expectations, these melanocytes and iridophores are discrete cells, but closely apposed. We show that parade encodes Endothelin receptor Aa, expressed in the blood vessels, most prominently in the medial blood vessels, consistent with the ventral trunk phenotype. We provide evidence that neuronal fates are not affected in parade mutants, arguing against transdifferentiation of sympathetic neurons to pigment cells. We show that inhibition of BMP signaling prevents specification of sympathetic neurons, indicating conservation of this molecular mechanism with chick and mouse. However, inhibition of sympathetic neuron differentiation does not enhance the parade phenotype. Instead, we pinpoint ventral trunk-restricted proliferation of neural crest cells as an early feature of the parade phenotype. Importantly, using a chemical genetic screen for rescue of the ectopic pigment cell phenotype of parade mutants (whilst leaving the embryonic pattern untouched), we identify ErbB inhibitors as a key hit. The time-window of sensitivity to these inhibitors mirrors precisely the window defined previously as crucial for the setting aside of APSCs in the embryo, strongly implicating adult pigment stem cells as the source of the ectopic pigment cells. We propose that a novel population of APSCs exists in association with medial blood vessels, and that their quiescence is dependent upon Endothelin-dependent factors expressed by the blood vessels.


Conflict of interest statement

The authors have declared that no competing interests exist.

Figures

Fig 1
Fig 1. pde mutants display ectopic melanocytes and iridophores, but not xanthophores, in the ventral medial pathway.
(A,B) Overview of early larval WT (A) and pde (B) pigment phenotype at 5 dpf. (C-F) Anatomical location of ectopic pigment cells in pde. Magnification of lateral views (white boxes in A and B) and cross sections of posterior trunks show no pigment cells on the medial migration pathway in the ventral trunk of WT larvae (C and D). Ectopic pigment cells are located in the ventral trunk of pde mutants (E; red arrowhead), under the dorsal aorta (DA) and above the posterior cardinal vein (PCV) as shown by cross sections (F, white arrowhead). (G-L) Whole mount in situ hybridization of 3 dpf WT (G-H) and pde mutants (J-L) embryos for dct (G and J), ednrba (H and K), and gch (I and L). Ectopic dct (J; white arrowhead) and ednrba (K; white arrowhead) expression is seen in the ventral trunk of pde mutant larvae. Neural tube (NT), notochord (NC) and ventral stripe (VS). Scale bar = 500 μm (A and B) and 100 μm (C and F) and 50 μm (G-L).
Fig 2
Fig 2. pde mutants show supernumerary melanocytes and iridophores in the Ventral Stripe and nearby medial migration pathway, but not the Dorsal Stripe.
(A-C) Transmission electron photomicrographs of ectopic pigment cells in pde mutants. Magnifications of yellow (B) and blue (C) boxes show melanosomes (m) and reflecting platelets (p) separated by a double membrane (C; white arrowheads). (D) Dot-plot of quantitation of ectopic melanocytes (M), iridophores (I) and overall number of ectopic pigment cells (sum of melanocytes and iridophores; M+I) from individual pde mutant larva at 4 dpf reveals a variable phenotype, with a consistently larger number of iridophores than melanocytes in the ectopic position (iridophores mean + s.e. = 17.26±0.99; melanocytes mean + s.e. = 2.44±0.34, n = 27). (E) Regions where number of pigment cells were counted, Dorsal Stripe (DS; orange line), Ventral Stripe (V; green line), posterior Ventral Stripe (PVS; pink line) and ventral medial pathway (VMP, red box). (F-I) Quantitation of number of melanocytes in dorsal (F; p>0.05, two-tailed t-test, WT mean + s.e. = 78.8+2.5, n = 20 and pde m + s.e. = 72.8 + 2.8, n = 17) and posterior ventral stripes (G; wild-type: mean + s.e. 55.0 + 2.5 n = 20; pde; 56.6 + 1.8, n = 17) show no significant (ns) difference between WT and pde mutants. Iridophore quantitation in the DS (H; p>0.05, two tailed t-test, WT mean + s.e. = 22.9 + 0.9, n = 29; pde mean + s.e. = 20.4 + 1.1, n = 22) is not different between WT and pde mutants while the ventral stripe has a 58% increased number of iridophores compared to WT embryos (I;***, p<0.0001, two-tailed t-test; WT mean + s.e. = 25.5 + 0.6, n = 49; pde mean + s.e. = 42.8 + 1.0, n = 43). Scale bar = 500 μm (E).
Fig 3
Fig 3. pde mutations affect ednraa, but not blood vessel formation and patterning.
(A) pde map position on chromosome 1. (B) Schematic of predicted mRNA structure based upon sequencing of cDNA from pdetj262, pdetv212 and pdehu4140 mutants. cDNA of pdetj262 mutants lack exon 7, pdetv212 lack exon 6 and pdehu4140 have a transition mutation (AGA847TGA) that causes a premature translation stop (triangle) in the 3’ region of exon 5. Predicted changes to EdnrAa protein are shown with respect to relevant extracellular domain (ECD), transmembrane domains (TD) and intracellular domains (ICD) of the multipass receptor protein. The location of the ednraa splice-blocking morpholino (MO-ednraa)is indicated (red bar). (C-D) Injection of ednraa morpholino into WT embryos phenocopies pde mutant pigment phenotype. (C) WT embryos injected with a control morpholino (MO-control) display a normal phenotype. (D) WT sibling injected with MO-ednraa display ectopic melanocytes (black arrowheads) and iridophores (white arrowheads) in the ventral medial pathway. (E-H) Whole mount in situ hybridization of ednraa at 24 hpf and 36 hpf is restricted to the developing blood vessels, and is indistinguishable between pde mutants (F and H) and their WT siblings. (I-J) Imaging of blood vessels in the posterior trunk using the transgenic reporter flia:GFP shows no difference in blood vessel morphology between WT siblings (I) and pde mutants (J). DA, Dorsal Aorta; PCV, Posterior Cardinal Vein; Se, Segmental Vessels. Scale bar = 100 μm (C,D, E and J) and 25μm (E-H).
Fig 4
Fig 4. Neural crest-derived peripheral neurons are not reduced in pde mutants, but a role for BMP signaling in sympathetic neuron specification is conserved in zebrafish.
Immunodetection of the neuronal marker Hu in 7 dpf WT embryos (A) and pde mutant siblings (B), shows no significant difference (ns) in the number of sympathetic neurons (K; WT mean+s.e. = 14.0+1.27, n = 18 and pde = 12.78+0.76, n = 18, n = 18; p>0.05, two-tailed t-test). (C-F) Immunodetection of the neuronal marker Hu in 5 dpf WT embryos (C and E) and pde mutant siblings (D and F) shows no significant (ns) difference in the number of sensory neurons per dorsal root ganglion (DRG; C and D; WT = 3.26+0.11, n = 15 and pde = 3.08+0.14, n = 12; >0.05, two-tailed t-test) nor in enteric neurons in the posterior gut (E, F and M; WT = 132.3+7.14, n = 8 and pde = 119.4+8.49, n = 8; p>0.05, two-tailed t-test). (G-J) Chemical inhibition of BMP signalling with dorsomorphin (iBMP 2.5 μM; 1–4 dpf treatment). Treatment of WT embryos shows a 63.25% reduction in the number of sympathetic neurons in comparison with 1% DMSO-treated controls (G, H and N; DMSO = 13.28+0.91, n = 18 and dorsomorphin = 4.88+0.47, n = 18; p<0.0001, two-tailed t-test). Quantification of the number of ectopic pigment cells in pde mutants treated with DMSO (I) or dorsomorphin (iBMP 2.5 μM; 1–4 dpf; J) shows no significant (ns) difference (O; DMSO mean+s.e. = 19.54+1.12, n = 13 and pde = 20.25+1.30, n = 12; p>0.05, two-tailed t-test). Weak red fluorescence in the fluorescent images result from autofluorescence of red blood cells. Scale bar = 100 μm (A-H same scale bar and I and J same scale bar).
Fig 5
Fig 5. Ectopic pigment cells in pde mutants are detectable by 35 hpf, and generated by localised increased proliferation of neural crest-derived cells.
(A-D) Whole mount in situ hybridization of 35 hpf WT (A and C) and pde mutant (B and D) embryos shows ectopic expression in pde mutants (white arrowheads in D) of melanocyte marker dct (A and B) and the iridophore marker ltk (C and D). (E-G) Immunodetection of the proliferation marker phosphohistone 3 (PH3) in neural crest derived cells (labelled with membrane–tethered GFP due to Tg(-4725sox10:cre)ba74; Tg(hsp:loxp-dsRed-loxp-LYN-EGFP)) of 32 hpf WT (E; white arrowhead) and pde mutant (F, white arrowheads) sibling embryos. Quantification of double positive GFP+ PH3+ cells in medial migratory pathway, shows a significant increase in pde mutants compared to WT siblings (Total; WT mean±s.e. = 3.9±0.42, n = 20 and pde = 6.05±0.41, n = 20; p<0.0009, two-tailed t-test). Subdividing this quantification of GFP+ PH3 cells in the medial migratory pathway into those dorsal and ventral to the notochord shows that this increase is not detected on the dorsal medial pathway (dorsal double positive cells, WT = 2.35±0.35, n = 20 and pde = 2.85±0.35, n = 20; p<0.3188, two-tailed t-test), but is significantly increased on the ventral medial pathway WT = 1.55±0.30, n = 20 and pde = 3.2±0.32, n = 20; p<0.0007, two-tailed t-test). Scale bar = 30 μm (A-D) 15 μm (E-F).
Fig 6
Fig 6. Chemical inhibition of Erb signalling rescues the pde phenotype.
(A-H) Treatment of pde embryos with increasing concentrations of Erb inhibitor PD158780 (iErb; 0.5–2.0 μM) or DMSO carrier control from 12–48 hpf (A-D), 19–30 hpf (E-H) and 24–30 hpf (I-L) hpf. Quantification of the number of ectopic pigment cells in the ventral medial pathway showed a decrease in the number of ectopic cells when embryos were treated from 12–48 hpf or just from 18–30 hpf, but not in a later 24–30 hpf time-window (M). Scale bar = 200 μm (A-L).
Fig 7
Fig 7. Model for the role of EdnrA signaling in pigment cell development.
A second source of APSCs is held in a quiescent state by Ednraa-dependent factors from the blood vessels. Figure shows a model integrating our observations with current knowledge. 1) Dorsal root ganglia associated APSCs (APSC) are maintained in a quiescent state by local factors (red); 2) we propose a second source of APSCs in the vicinity of the medial blood vessels. Ednraa/pde activity in the blood vessels results in signals that hold this novel population in a quiescent state (3). In the pde mutants, these factors (red) are lost locally from the blood vessels and the APSCs become precociously activated, generating melanocytes and iridophores in their vicinity.

References

    1. Irion U, Singh AP, Nusslein-Volhard C. The Developmental Genetics of Vertebrate Color Pattern Formation: Lessons from Zebrafish. Curr Top Dev Biol. 2016;117:141–69. 10.1016/bs.ctdb.2015.12.012 . - DOI - PubMed
    1. Schartl M, Larue L, Goda M, Bosenberg MW, Hashimoto H, Kelsh RN. What is a vertebrate pigment cell? Pigment Cell Melanoma Res. 2016;29(1):8–14. 10.1111/pcmr.12409 . - DOI - PubMed
    1. Kelsh RN. Genetics and evolution of pigment patterns in fish. Pigment Cell Res. 2004;17(4):326–36. 10.1111/j.1600-0749.2004.00174.x . - DOI - PubMed
    1. Kelsh RN, Harris ML, Colanesi S, Erickson CA. Stripes and belly-spots—a review of pigment cell morphogenesis in vertebrates. Semin Cell Dev Biol. 2009;20(1):90–104. Epub 2008/11/04. 10.1016/j.semcdb.2008.10.001 - DOI - PMC - PubMed
    1. Parichy DM. Animal pigment pattern: an integrative model system for studying the development, evolution, and regeneration of form. Semin Cell Dev Biol. 2009;20(1):63–4. Epub 2009/01/17. 10.1016/j.semcdb.2008.12.010 . - DOI - PMC - PubMed

Publication types

MeSH terms