

Trends in global shark attacks
- PMID: 30811398
- PMCID: PMC6392223
- DOI: 10.1371/journal.pone.0211049
Trends in global shark attacks
Abstract
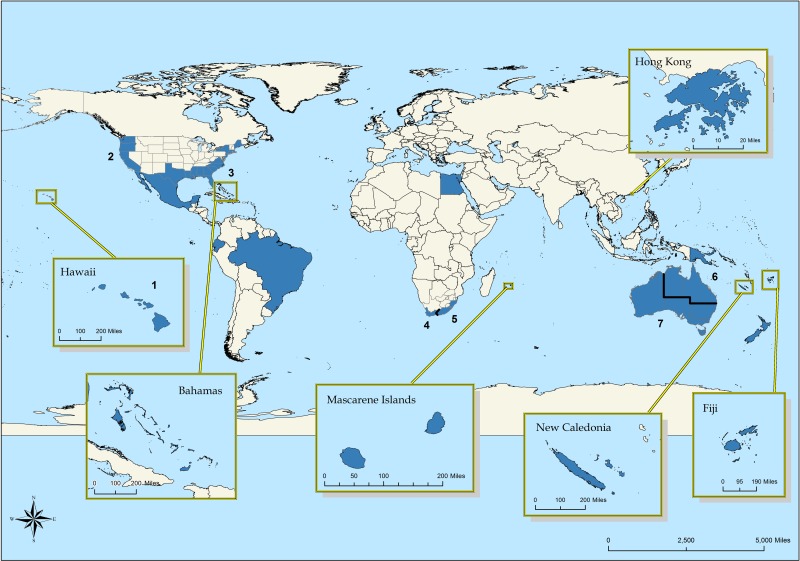
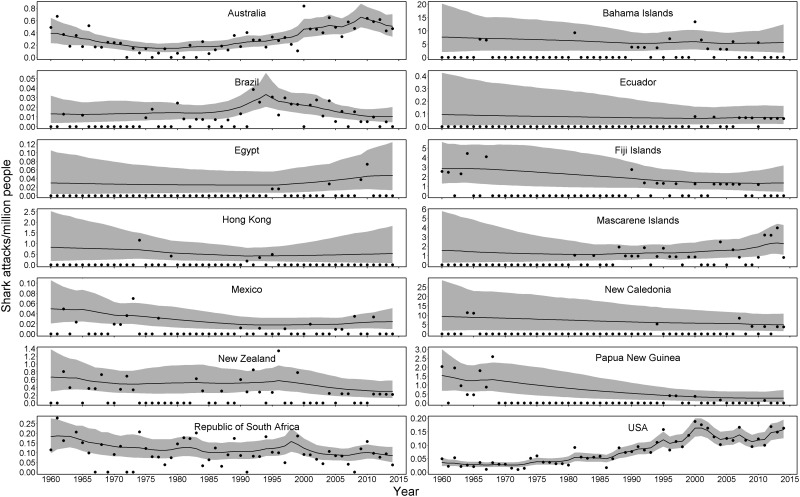
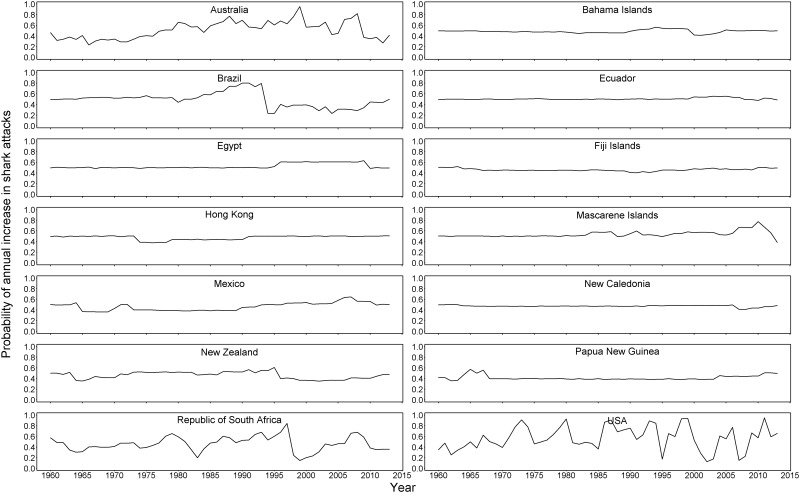
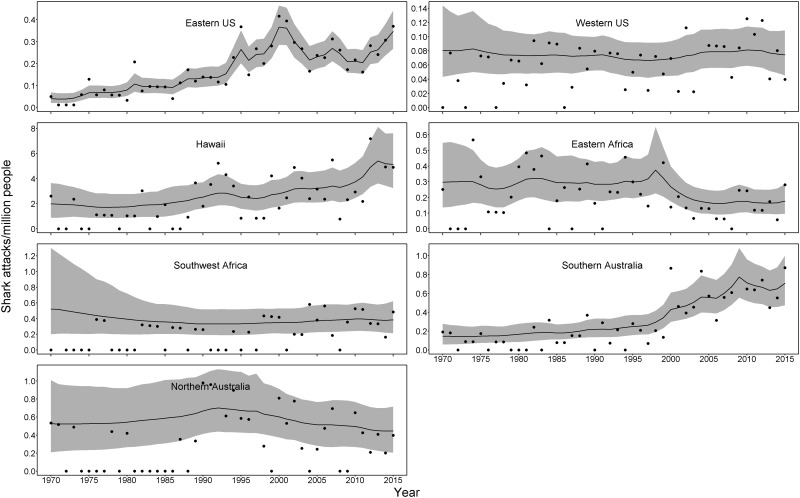
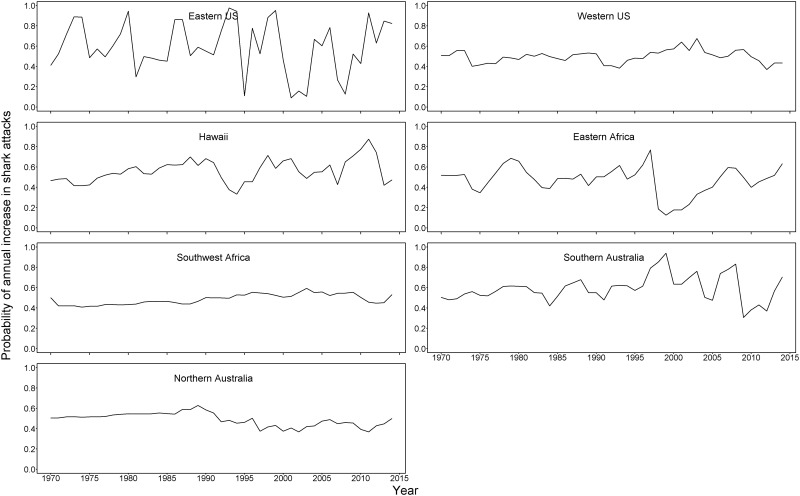
Shark attacks are a global phenomenon that attracts widespread attention and publicity, often with negative outcomes for shark populations. Despite the widespread perceptions of shark attacks, trends in human water activities and shark populations are both dynamic, resulting in variable rates of shark attacks over space and time. Understanding variable trends in shark attacks may contribute to a better understanding of risk, and a more tempered response in the wake of an attack. We found that global shark attack rates are low, yet variable across global regions and over decades. Countries with low populations were found to have the highest rates of attack, while countries with high populations (U.S.A., Australia, South Africa) tended to have overall low attack rates, but also much more interannual variability. From the 1960s to the present, those countries with the highest populations also tended to be the places where attack rates have increased. Ultimately, shark attack risk is also driven by local conditions (e.g., time of day, species present); however, a global scale understanding of attack rates helps place risk into perspective and may contribute to a more scientifically-grounded discussion of sharks, and their management and conservation.
Conflict of interest statement
The authors have declared that no competing interests exist.
Figures
References
-
- Karl SA, Castro ALF, Lopez JA, Charvet P, Burgess GH. Phylogeography and conservation of the bull shark (Carcharhinus leucas) inferred from mitochondrial and microsatellite DNA. Conservation Genetics. 2010;12(2):371–382. 10.1007/s10592-010-0145-1 - DOI
-
- Bethea DM, Ajemian MJ, Carlson JK, Hoffmayer ER, Imhoff JL, Grubbs RD, et al. Distribution and community structure of coastal sharks in the northeastern Gulf of Mexico. Environmental Biology of Fishes. 2014;98(5):1233–1254. 10.1007/s10641-014-0355-3 - DOI
-
- Heupel MR, Knip DM, Simpfendorfer CA, Dulvy NK. Sizing up the ecological role of sharks as predators. Marine Ecology Progress Series. 2014;495:291–298. 10.3354/meps10597 - DOI
-
- Winemiller KO, Rose KA. Patterns of life-history diversification in North American fishes: implications for population regulation. Canadian Journal of Fisheries and Aquatic Sciences. 1992;49(10):2196–2218. 10.1139/f92-242 - DOI
MeSH terms
LinkOut - more resources
Full Text Sources
Medical
