. 2019 Feb 27;14(2):e0205083.
doi: 10.1371/journal.pone.0205083. eCollection 2019.

Multispectral imaging and unmanned aerial systems for cotton plant phenotyping

Affiliations

Multispectral imaging and unmanned aerial systems for cotton plant phenotyping

Rui Xu et al. PLoS One. .

Abstract

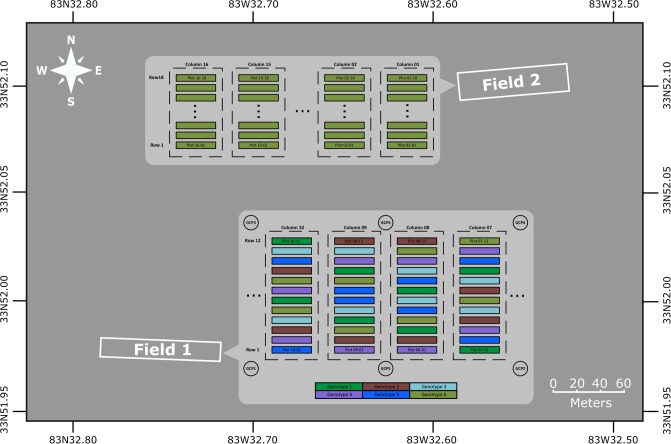
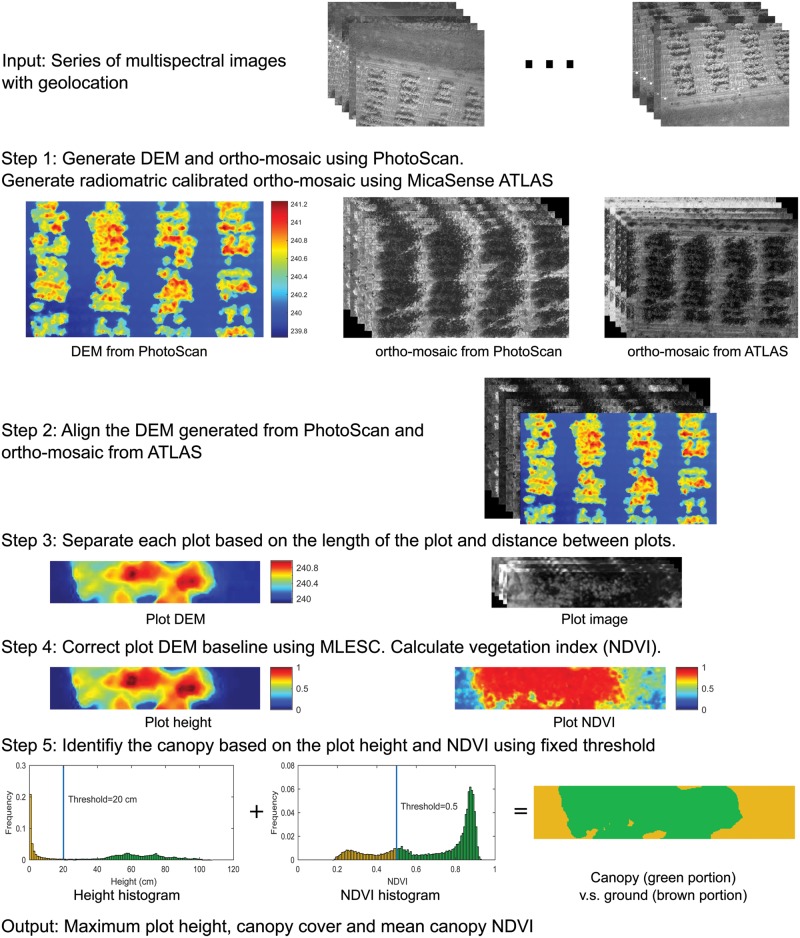
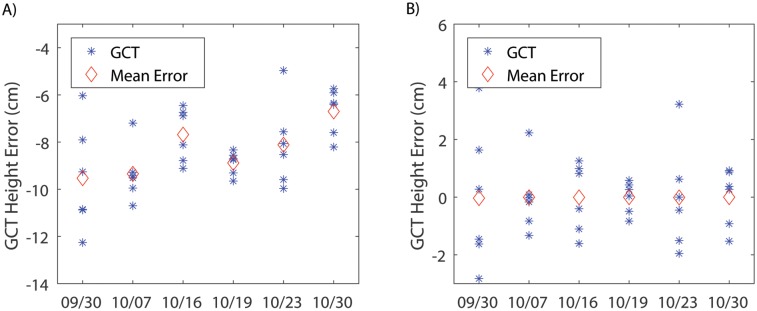
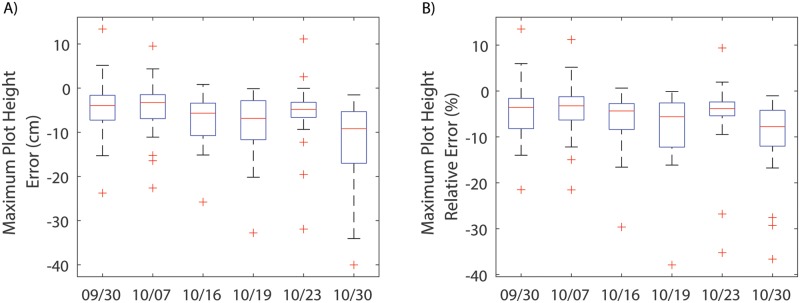
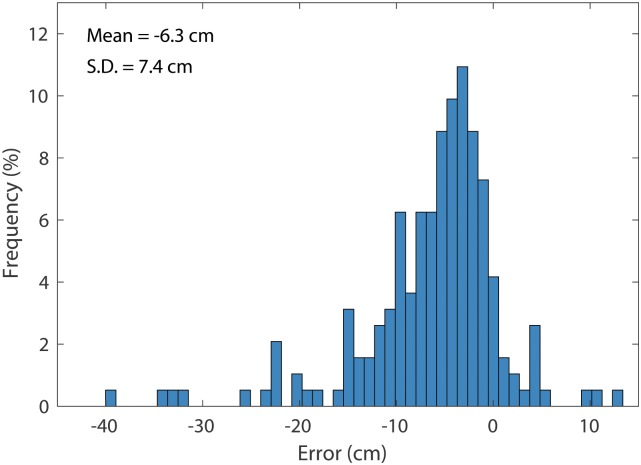
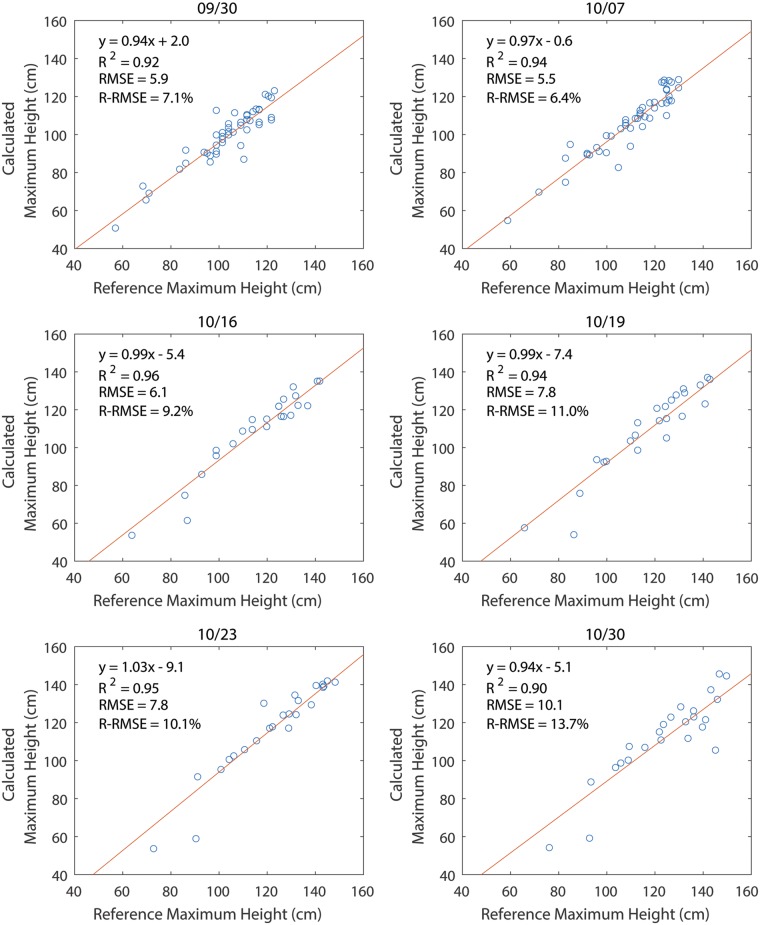
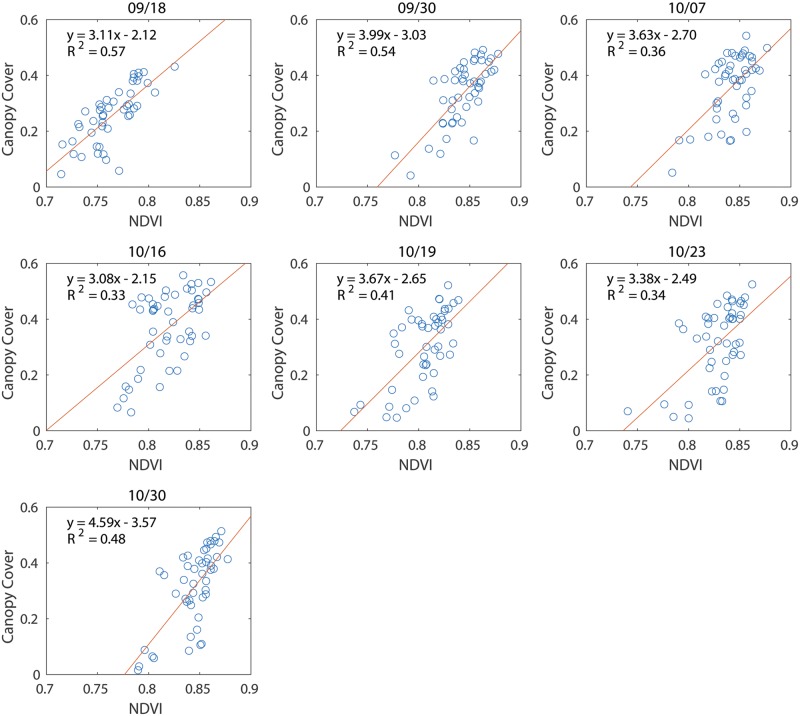
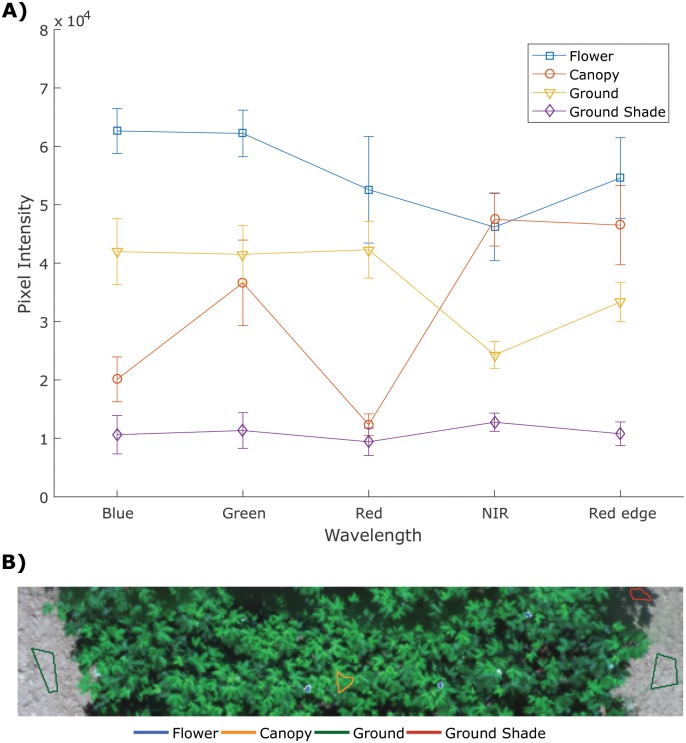
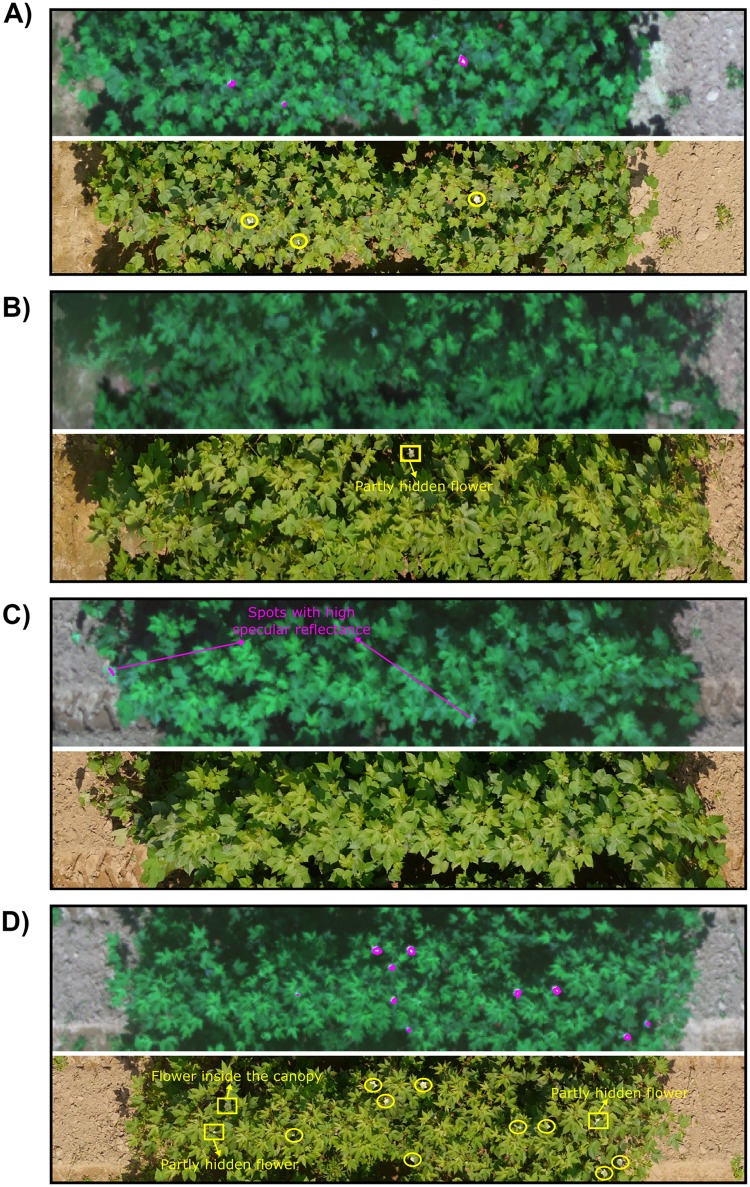
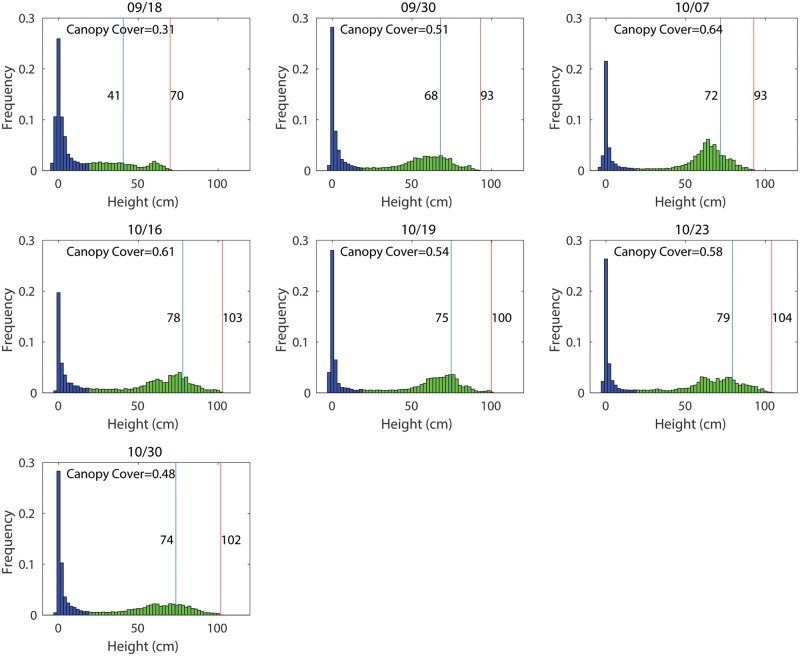
This paper demonstrates the application of aerial multispectral images in cotton plant phenotyping. Four phenotypic traits (plant height, canopy cover, vegetation index, and flower) were measured from multispectral images captured by a multispectral camera on an unmanned aerial system. Data were collected on eight different days from two fields. Ortho-mosaic and digital elevation models (DEM) were constructed from the raw images using the structure from motion (SfM) algorithm. A data processing pipeline was developed to calculate plant height using the ortho-mosaic and DEM. Six ground calibration targets (GCTs) were used to correct the error of the calculated plant height caused by the georeferencing error of the DEM. Plant heights were measured manually to validate the heights predicted from the imaging method. The error in estimation of the maximum height of each plot ranged from -40.4 to 13.5 cm among six datasets, all of which showed strong linear relationships with the manual measurement (R2 > 0.89). Plot canopy was separated from the soil based on the DEM and normalized differential vegetation index (NDVI). Canopy cover and mean canopy NDVI were calculated to show canopy growth over time and the correlation between the two indices was investigated. The spectral responses of the ground, leaves, cotton flower, and ground shade were analyzed and detection of cotton flowers was satisfactory using a support vector machine (SVM). This study demonstrated the potential of using aerial multispectral images for high throughput phenotyping of important cotton phenotypic traits in the field.


Conflict of interest statement

The authors have declared that no competing interests exist.

Figures

Fig 1
Fig 1. Location and plot layout of the two test fields.
The genotypes of the plots in field 1 were indicated in different colors.
Fig 2
Fig 2. Data processing flowchart.
DEM: digital elevation model. MLESC: maximum likelihood estimation sample consensus. NDVI: normalized difference vegetation index.
Fig 3
Fig 3. Accuracy of height measurements of the ground calibration targets by the imaging method.
A) The error in calculating ground calibration target heights before error correction. B) The error in calculating ground calibration target heights after error correction.
Fig 4
Fig 4. Error of the calculated maximum plot height.
A) The absolute error in calculating maximum plot heights. B) The relative error in calculating maximum plot height.
Fig 5
Fig 5. The error distribution for the maximum plot height.
Fig 6
Fig 6. Correlation between calculated maximum plot heights and manually measured maximum plot heights using a linear model.
Fig 7
Fig 7. Correlation between NDVI and canopy cover on different dates.
Fig 8
Fig 8
A) Pixel values of four objects (flower, canopy, ground, and ground shade). B) The four regions of interest in the image.
Fig 9
Fig 9. Example plots of the automatically detected flowers in the multispectral images (composited from the blue, red, and green band) and manually identified flowers in the color images.
In the multispectral images (top image in each panel), the magenta lines indicate detected flowers. In the color images (bottom image in each panel), the yellow circles indicate detected flowers and the yellow squares indicate undetected flowers in multispectral images. A) All the flowers in the color image were detected in the multispectral image. B) The flower inside the canopy was not detected in the multispectral image. C) Spots with high specular reflectance from the leaves were misclassified as flowers in multispectral images while the color images showed no flowers. D) Most of the flowers in the color image were detected in the multispectral image. Two partly hidden flowers and one flower inside the canopy were not detected in the multispectral image.
Fig 10
Fig 10. Histogram of the height for one plot over 42 days.
Blue and green areas indicate the ground and canopy, respectively. Blue and red lines respectively indicate the 85th and 100th percentile (maximum) of canopy heights.

References

    1. Tilman D, Balzer C, Hill J, Befort BL. Global food demand and the sustainable intensification of agriculture. Proceedings of the National Academy of Sciences of the United States of America. 2011;108(50):20260–20264. 10.1073/pnas.1116437108 - DOI - PMC - PubMed
    1. Phillips RL. Mobilizing Science to Break Yield Barriers. Crop Science. 2010;50(2):S99–S108. 10.2135/cropsci2009.09.0525 - DOI
    1. Cabrera-Bosquet L, Crossa J, von Zitzewitz J, Serret MD, Araus JL. High-throughput Phenotyping and Genomic Selection: The Frontiers of Crop Breeding Converge. Journal of Integrative Plant Biology. 2012;54(5):312–320. 10.1111/j.1744-7909.2012.01116.x - DOI - PubMed
    1. Araus JL, Cairns JE. Field high-throughput phenotyping: the new crop breeding frontier. Trends in Plant Science. 2014;19(1):52–61. 10.1016/j.tplants.2013.09.008 - DOI - PubMed
    1. Busemeyer L, Mentrup D, Moller K, Wunder E, Alheit K, Hahn V, et al. BreedVision—A Multi-Sensor Platform for Non-Destructive Field-Based Phenotyping in Plant Breeding. Sensors. 2013;13(3):2830–2847. 10.3390/s130302830 - DOI - PMC - PubMed

Publication types

LinkOut - more resources