Multicenter Study
. 2019 Feb 1;60(2):795-806.
doi: 10.1167/iovs.18-25407.

Factors Influencing Optical Coherence Tomography Peripapillary Choroidal Thickness: A Multicenter Study

Affiliations
Multicenter Study

Factors Influencing Optical Coherence Tomography Peripapillary Choroidal Thickness: A Multicenter Study

Hongli Yang et al. Invest Ophthalmol Vis Sci. .

Abstract

Purpose: To quantify peripapillary choroidal thickness (PCT) and the factors that influence it in healthy participants who represent the racial and ethnic composition of the U.S. population.

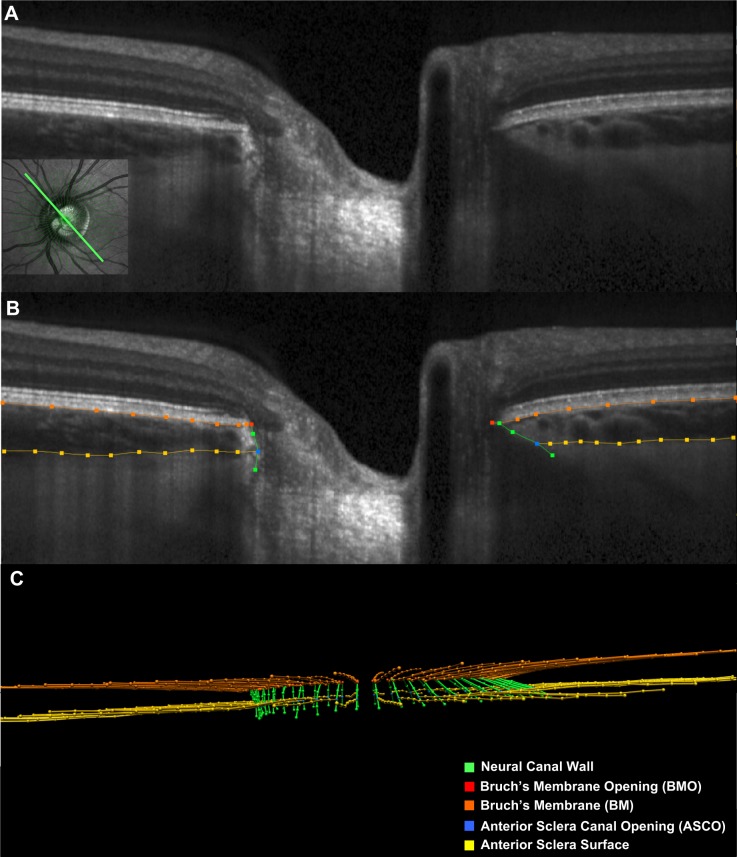
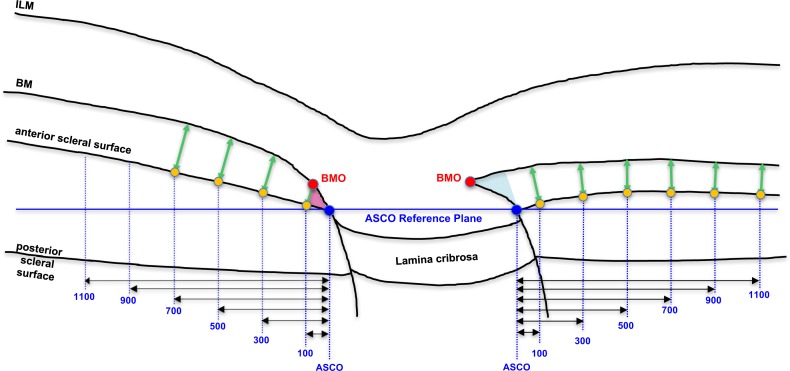
Methods: A total of 362 healthy participants underwent optical coherence tomography (OCT) enhanced depth imaging of the optic nerve head with a 24 radial B-scan pattern aligned to the fovea to Bruch's membrane opening axis. Bruch's membrane, anterior scleral canal opening (ASCO), and the anterior scleral surface were manually segmented. PCT was measured at 100, 300, 500, 700, 900, and 1100 μm from the ASCO globally and within 12 clock-hour sectors. The effects of age, axial length, intraocular pressure, ethnicity, sex, sector, and ASCO area on PCT were assessed by ANOVA and univariable and multivariable regressions.

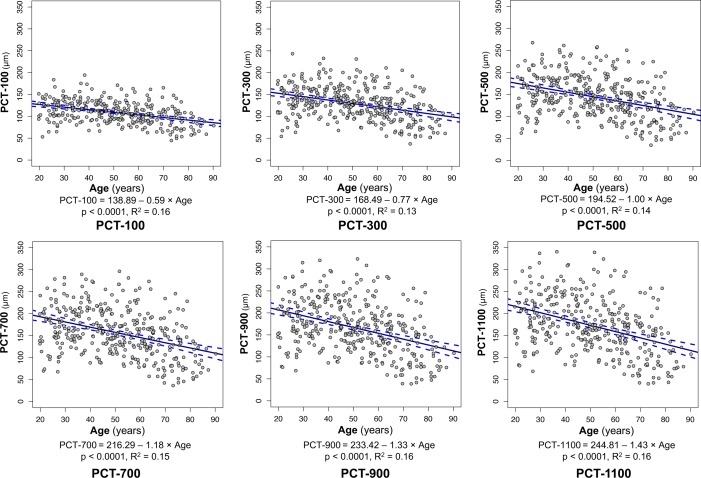
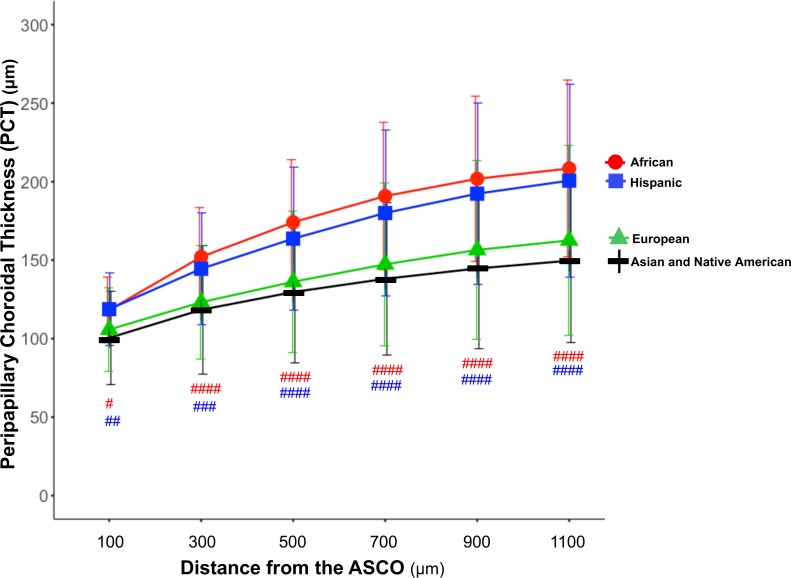
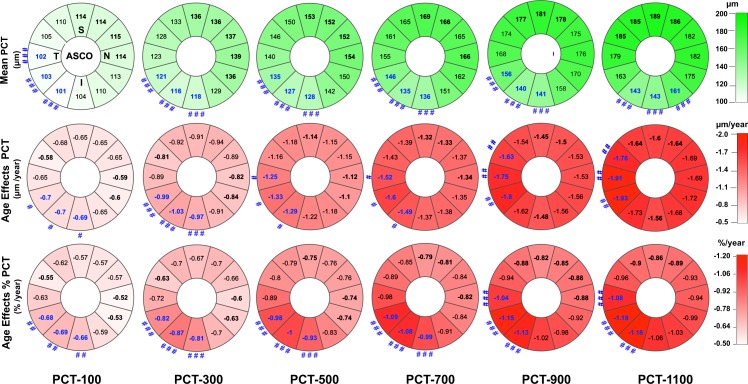
Results: Globally, PCT was thicker further from the ASCO border and thinner with older age, longer axial length, larger ASCO area, European descent, and female sex. Among these effectors, age and axial length explained the greatest proportion of variance. The rate of age-related decline increased further from the ASCO border. Sectorally, the inferior-temporal sectors were thinnest (10.7%-20.0% thinner than the thickest sector) and demonstrated a higher rate of age-related loss (from 15.6% to 20.7% faster) at each ASCO distance.

Conclusions: In healthy eyes, PCT was thinnest in the inferior temporal sectors and thinner PCT was associated with older age, European descent, longer axial length, larger ASCO area, and female sex. Among these associations, age had the strongest influence, and its effect was greatest within the inferior temporal sectors.


Figures

Figure 1
Figure 1
Manual segmentation of each radial B-scan. (A) A representative 150 radial B-scan is shown with its location depicted in green within the inlayed infrared reflectance (IR) image (bottom left). (B) Manually segmented ONH landmarks for this study within the B-scan shown in (A). Orange lines/points are the posterior surface of the Bruch's Membrane/RPE complex, gold lines/points are the anterior surface of the sclera. Green lines/points are the neural canal wall, red points are BMO, and blue points are the ASCO. (C) Point cloud of segmented points from the complete set of 24 radial B-scans obtained for this ONH.
Figure 2
Figure 2
Measurement of peripapillary choroidal thickness at six distances (measured in microns) from the ASCO within the ASCO reference plane. Within the three-dimensional point cloud of segmented points from each OCT ONH data set (Figure 1C, above), Bruch's membrane and anterior scleral surface points were interpolated using b-splines. PCT was assessed in microns at six distances (vertical blue dotted lines) from the ASCO, measured within the ASCO reference plane (horizontal blue line). Each measurement distance was projected from the ASCO to the anterior sclera surface (yellow dots). At each anterior scleral measurement point, PCT was defined by the minimum distance to the posterior surface of Bruch's membrane (green arrows: PCT-100, PCT-300, PCT-500, PCT-700, PCT-900, and PCT-1100, respectively). In this study, PCT measurements within the regions of border tissues of Elschnig (BTE) obliqueness (pink externally oblique, left; blue internally oblique, right) were not included in the normative values as explained in Figure 3.
Figure 3
Figure 3
Although regions of internally and externally oblique BTE are defined by the offset of OCT BMO relative to OCT ASCO, PCT measurements within these regions are not included in the normative values of this report. (A) Color optic disc photo of the study eye of subject FDA287, with colocalized OCT ASCO (blue) and OCT BMO (red) points. The location and orientation (B1–B2) and (D1-D2) of the cropped B-scans shown in B, C and D, E are shown. (B) Cropped superior-nasal B-scan in a region of internally oblique BTE, (B1-B2) shown in A and delineated in (C). Note that BMO is “internal” to ASCO (or closer to the center of the disc). Note also that the suggestion of a juxta-scleral canal posterior ciliary vessel entering the choroid from the sclera (red dots). (D) Cropped inferior-temporal B-scan in a region of externally oblique BTE (D1-D2) shown in A and delineated in (E). Note that BMO is “external” to ASCO (or farther from the center of the disc). Although externally oblique border tissues do not represent atrophy in any form, they are commonly referred to as gamma peripapillary atrophy in the clinical and OCT,, literature. (F) The clinical extent of internally (blue) and externally (pink) oblique BTE in a healthy study eye with mild myopia (spherical equivalent −4.25D, axial length 25.13 mm). In this cross-sectional study, PCT measurements within the regions of BTE obliqueness were not included in the normative values because when present the density of the border tissues themselves and the adjacent choroidal septa made the presence of active choroidal vasculature difficult to determine and because the occurrence and regional distribution of internally and externally oblique border tissues are not consistent among all human eyes. However, PCT can be measured relative to the ASCO within both forms of oblique border tissue regions, and the individual eye longitudinal change within these regions may be clinically important.
Figure 4
Figure 4
FoBMO 30° ONH sectors for a representative study eye (FDA056). The fovea (yellow dot) and four BMO points were anatomically identified using real-time OCT imaging at the time of image acquisition by the technician. The delineated BMO points from the 24 acquired OCT B-scans are projected onto the IR image along with the geometric center of BMO (BMO centroid - red dot with yellow border) so as to establish the foveal to BMO (FoBMO) axis. Twelve 30° (clock-hour) sectors were then established relative to the FoBMO axis. Note that the use of the FoBMO axis for orientation rather than the acquired image frame vertical and horizontal axes (blue dotted lines) means that the 12 FoBMO sectors were applied in an anatomically consistent fashion to each study eye.,, S, superior; SN, superior nasal; NS, nasal superior; N, nasal; NI, nasal inferior; IN, inferior nasal; I, inferior; IT, inferior temporal; TI, temporal inferior; T, temporal; TS, temporal superior; ST, superior temporal.
Figure 5
Figure 5
Scatterplot and univariate linear regression of PCT and age at each measurement point. Panels depict data at the 100, 300, and 500 μm measurement distances above and the 700, 900, and 1100 μm distances below. The slope of the regression line achieved significance at the P < 0.0001 level at all distances from the ASCO. Solid blue lines indicate fitted linear regression lines; dotted blue curves indicate the 95% CI of the regression lines; gray circles with black border indicate individual eye values.
Figure 6
Figure 6
PCT by ethnicity and distance from the ASCO. The mean (± standard deviation) PCT for the four ethnicity groups are plotted for the six measurement distances from the ASCO. PCT was compared between European, Hispanic, and African descent ethnicities. PCT was thicker in the African descent and Hispanic ethnicity groups when compared with the European descent group, respectively, at all six distances from the ASCO (Table 3). P values by general linear regression by general estimation equation model are depicted for each comparison in red or blue as follows: ####P < 0.0001; ###P < 0.001; ##P < 0.01; #P < 0.05). The differences between the African descent and Hispanic ethnicity groups did not achieve significance.
Figure 7
Figure 7
FoBMO sectoral mean PCT (upper row), age-related PCT change (middle row), and age-related percent PCT change (%PCT, lower row) at six proximal (PCT-100 μm) to distal (PCT-1100 μm) locations from the ASCO. Data are presented in right eye orientation (upper left) by 30° (clock-hour) sectors that are oriented relative to the FoBMO axis. The mean PCT within each sector at six measurement locations (extending from 100 μm from the ASCO (left most column) to 1100 μm from the ASCO (right most column) are shown (upper row). The mean PCT of the top three thickest sectors at each measurement distance are bold black. The mean PCT of the top three thinnest sectors are bold blue. The thinnest sectors are significantly thinner than the thickest sectors when they are accompanied by a number sign symbol (see below). The rate of PCT change with age in each sector (μm/y), after adjusting for axial length, ASCO area, IOP, ethnicity, and sex (middle row). The sectors with the top three slowest rates of change are bold black. The sectors with the top three fastest rates of change are bold blue. The rates of change of the fastest sectors are significantly faster than the slowest sectors when they are accompanied by a number sign symbol (legend below). The rate of %PCT change with age in each sector after adjusting for the same covariates (lower row). The sectors with the three lowest rates of %PCT change are bold black. The sectors with the three fastest rates of %PCT change are shown in bold blue. The fastest sectors are significantly faster than the slowest sectors when accompanied by a number sign symbol. Significant differences, by a general estimation equation model are depicted by ###P < 0.001; ##P < 0.01; and #P < 0.05, respectively.

Similar articles

Cited by

References

    1. Luo H, Yang H, Gardiner SK, et al. Factors influencing central lamina cribrosa depth: a multicenter study. Invest Ophthalmol Vis Sci. 2018;59:2357–2370. - PMC - PubMed
    1. Hayreh SS, Jonas JB, Zimmerman MB. Parapapillary chorioretinal atrophy in chronic high-pressure experimental glaucoma in rhesus monkeys. Invest Ophthalmol Vis Sci. 1998;39:2296–2303. - PubMed
    1. Hayreh SS, Pe'er J, Zimmerman MB. Morphologic changes in chronic high-pressure experimental glaucoma in rhesus monkeys. J Glaucoma. 1999;8:56–71. - PubMed
    1. Vianna JR, Malik R, Danthurebandara VM, et al. Beta and gamma peripapillary atrophy in myopic eyes with and without glaucoma. Invest Ophthalmol Vis Sci. 2016;57:3103–3111. - PubMed
    1. Hayashi K, Tomidokoro A, Lee KY, et al. Spectral-domain optical coherence tomography of beta-zone peripapillary atrophy: influence of myopia and glaucoma. Invest Ophthalmol Vis Sci. 2012;53:1499–1505. - PubMed

Publication types