Multicenter Study
. 2019 Oct;50(4):1260-1267.
doi: 10.1002/jmri.26693. Epub 2019 Feb 27.

Automated image quality evaluation of structural brain MRI using an ensemble of deep learning networks

Affiliations
Multicenter Study

Automated image quality evaluation of structural brain MRI using an ensemble of deep learning networks

Sheeba J Sujit et al. J Magn Reson Imaging. 2019 Oct.

Abstract

Background: Deep learning (DL) is a promising methodology for automatic detection of abnormalities in brain MRI.

Purpose: To automatically evaluate the quality of multicenter structural brain MRI images using an ensemble DL model based on deep convolutional neural networks (DCNNs).

Study type: Retrospective.

Population: The study included 1064 brain images of autism patients and healthy controls from the Autism Brain Imaging Data Exchange (ABIDE) database. MRI data from 110 multiple sclerosis patients from the CombiRx study were included for independent testing.

Sequence: T1 -weighted MR brain images acquired at 3T.

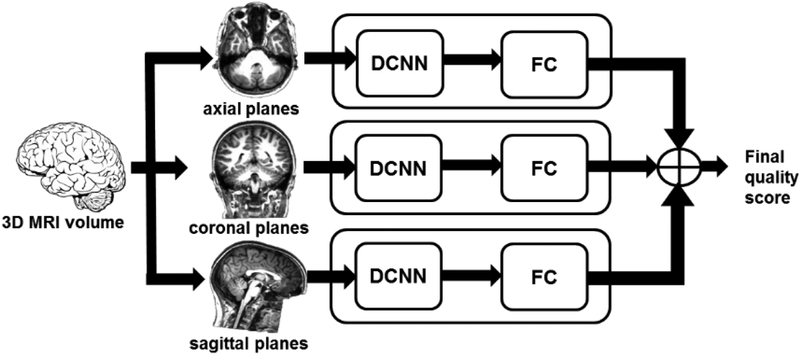
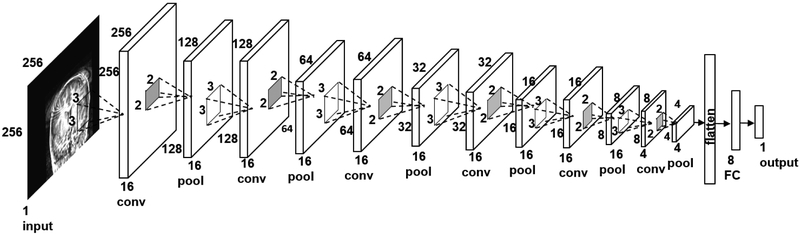
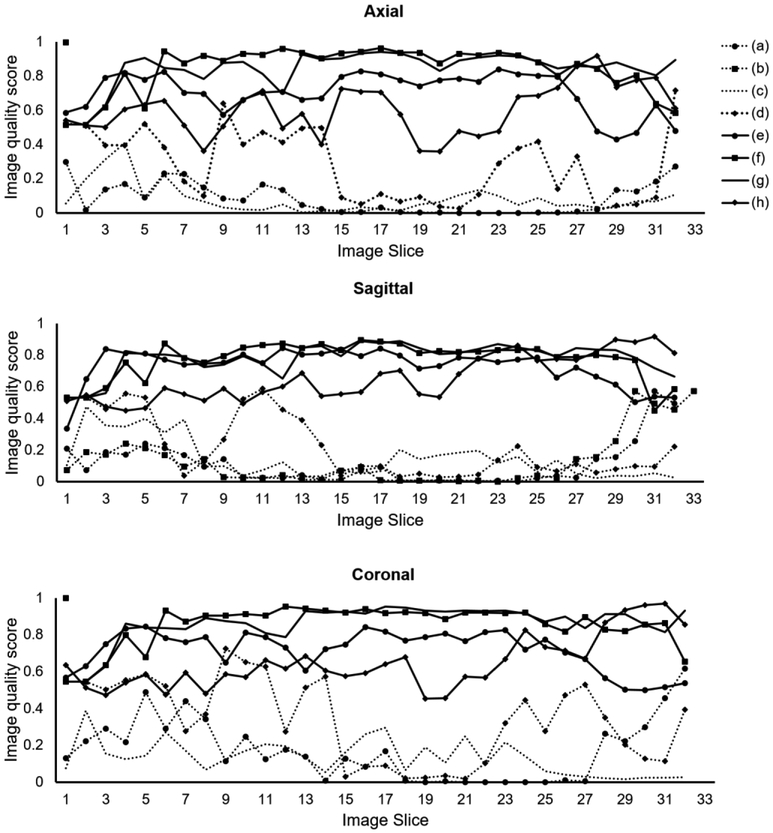
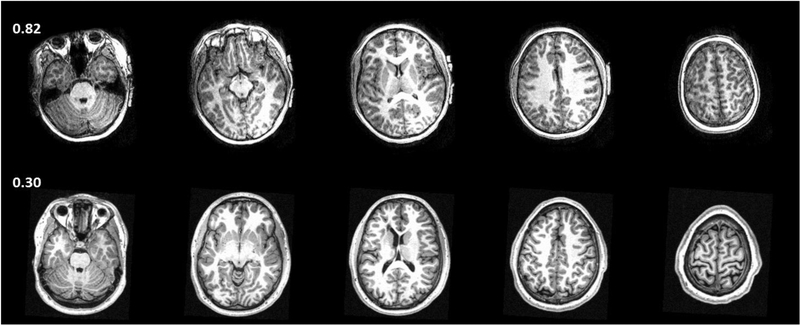
Assessment: The ABIDE data were separated into training (60%), validation (20%), and testing (20%) sets. The ensemble DL model combined the results from three cascaded networks trained separately on the three MRI image planes (axial, coronal, and sagittal). Each cascaded network consists of a DCNN followed by a fully connected network. The quality of image slices from each plane was evaluated by the DCNN and the resultant image scores were combined into a volumewise quality rating using the fully connected network. The DL predicted ratings were compared with manual quality evaluation by two experts.

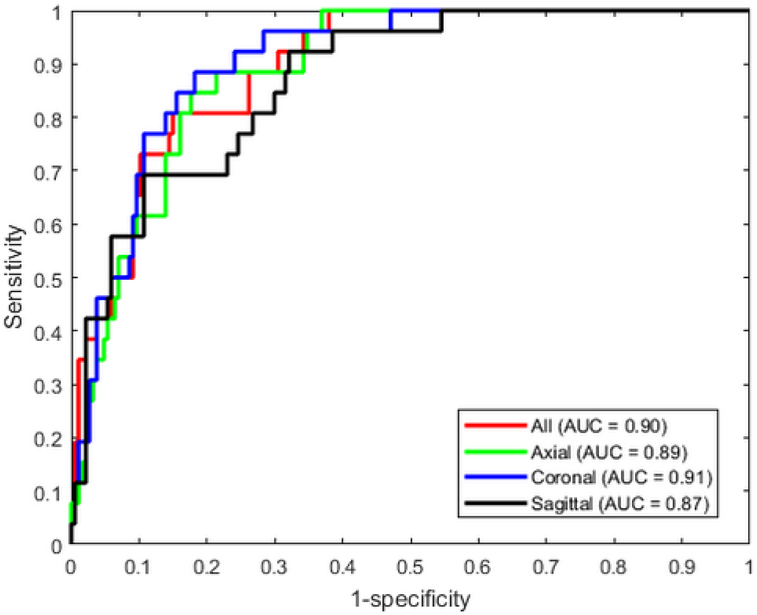
Statistical tests: Receiver operating characteristic (ROC) curve, area under ROC curve (AUC), sensitivity, specificity, accuracy, and positive (PPV) and negative (NPV) predictive values.

Results: The AUC, sensitivity, specificity, accuracy, PPV, and NPV for image quality evaluation of the ABIDE test set using the ensemble model were 0.90, 0.77, 0.85, 0.84, 0.42, and 0.96, respectively. On the CombiRx set the same model achieved performance of 0.71, 0.41, 0.84, 0.73, 0.48, and 0.80.

Data conclusion: This study demonstrated the high accuracy of DL in evaluating image quality of structural brain MRI in multicenter studies.

Level of evidence: 3 Technical Efficacy: Stage 2 J. Magn. Reson. Imaging 2019;50:1260-1267.

Keywords: brain MRI; deep learning; postprocessing; quality assessment.


Figures

Figure 1.
Figure 1.
Architecture of the deep learning image quality evaluation model. The extracted 32 slices along the 3 plane (axial, coronal, and sagittal) were used as input to DCNN to predict the quality of each slice. The slice quality scores were next used as input to a fully-connected (FC) network to predict the volume-wise quality. An ensemble model was constructed by averaging the image quality scores from the three cascaded networks.
Figure 2.
Figure 2.
Architecture of the deep convolutional neural network (DCNN) for predicting image quality of individual brain slices. conv – convolutional layer, pool – maxpooling layer, FC – fully connected layer.
Figure 3.
Figure 3.
Receiver operating characteristic curves of the DL networks trained with individual planes and the ensemble model that averages the predictions from all planes.
Figure 4.
Figure 4.
Concordant quality classification cases from ABIDE dataset showing images with acceptable quality (a-d) and images with unacceptable quality (e-h). The image quality scores predicted by the DL model are shown. Scores close to 0 indicate high image quality, and scores close to 1 indicate poor quality.
Figure 5.
Figure 5.
Image quality score for individual slices of the eight sample images shown in Fig. 4 along the three image planes (axial, coronal, sagittal). (a–d) Correctly-predicted cases with acceptable image quality. (e–h) Correctly-predicted cases with unacceptable image quality.
Figure 6.
Figure 6.
Discordant cases from ABIDE dataset. Experts labeled the image in the upper row (columns show different slices from the same subject) as acceptable quality but the DL model classified it as unacceptable (score = 0.82). There are motion artifacts evident in the images which were missed or disregarded by the experts. Images in the lower row were labelled as unacceptable by the experts, but were predicted as acceptable (score = 0.30) by DL model.

References

    1. Osadebey M, Pedersen M, Arnold D, Wendel-Mitoraj K: Image Quality Evaluation in Clinical Research: A Case Study on Brain and Cardiac MRI Images in Multi-Center Clinical Trials. IEEE J Transl Eng Heal Med 2018; 6:1–15. - PMC - PubMed
    1. Reuter M, Tisdall MD, Qureshi A, Buckner RL, van der Kouwe AJW, Fischl B: Head motion during MRI acquisition reduces gray matter volume and thickness estimates. Neuroimage 2015; 107:107–115. - PMC - PubMed
    1. Alexander-Bloch A, Clasen L, Stockman M, et al.: Subtle in-scanner motion biases automated measurement of brain anatomy from in vivo MRI. Hum Brain Mapp 2016; 37:2385–2397. - PMC - PubMed
    1. Mortamet B, Bernstein MA, Jack CR, et al.: Automatic quality assessment in structural brain magnetic resonance imaging. Magn Reson Med 2009; 62:365–372. - PMC - PubMed
    1. Alfaro-Almagro F, Jenkinson M, Bangerter NK, et al.: Image processing and Quality Control for the first 10,000 brain imaging datasets from UK Biobank. Neuroimage 2018; 166:400–424. - PMC - PubMed

Publication types

MeSH terms