. 2019 Feb 22;19(4):920.
doi: 10.3390/s19040920.

Deep Learning-Based Framework for In Vivo Identification of Glioblastoma Tumor using Hyperspectral Images of Human Brain

Affiliations

Deep Learning-Based Framework for In Vivo Identification of Glioblastoma Tumor using Hyperspectral Images of Human Brain

Himar Fabelo et al. Sensors (Basel). .

Abstract

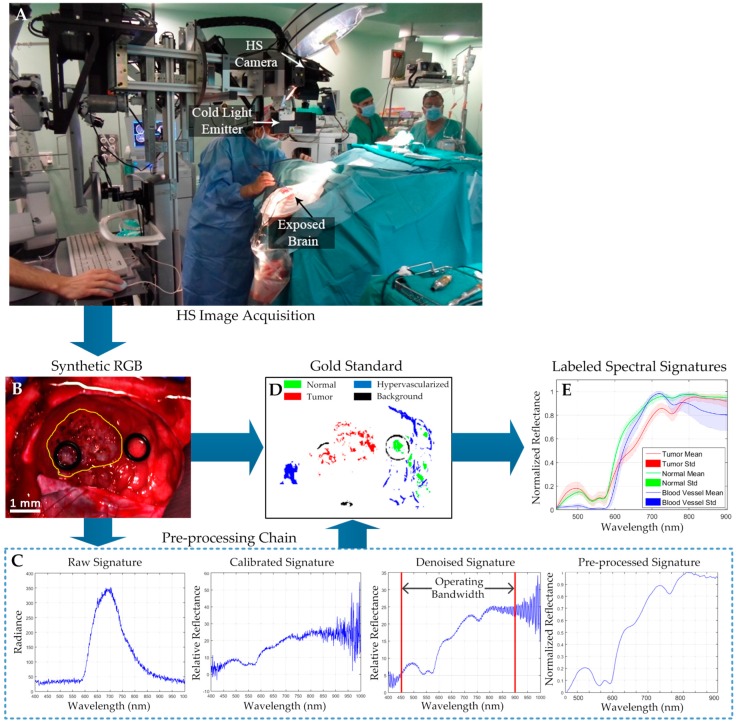
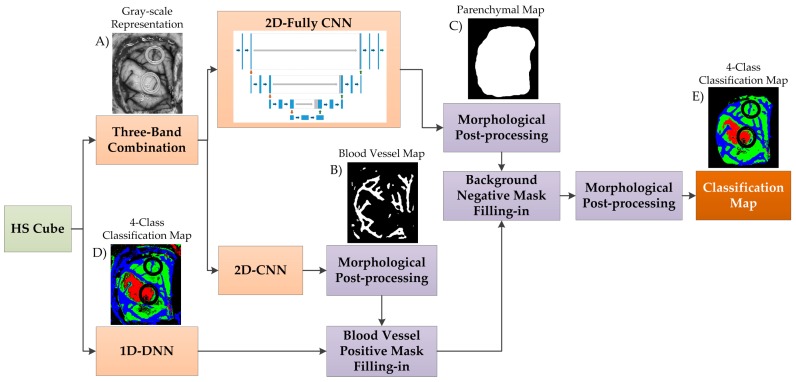
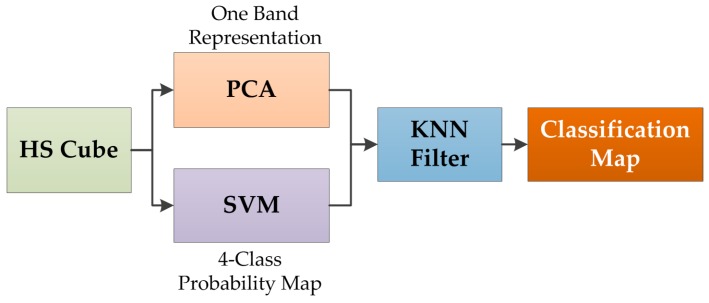
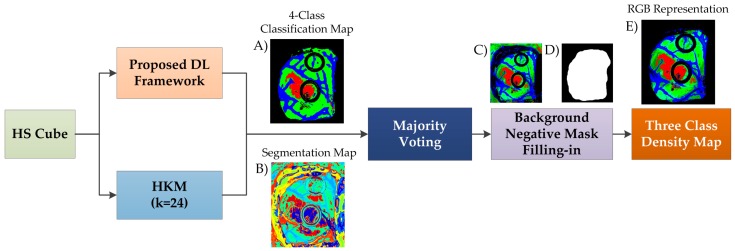
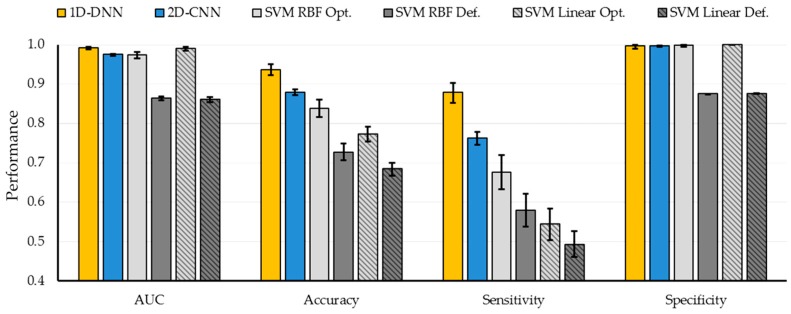
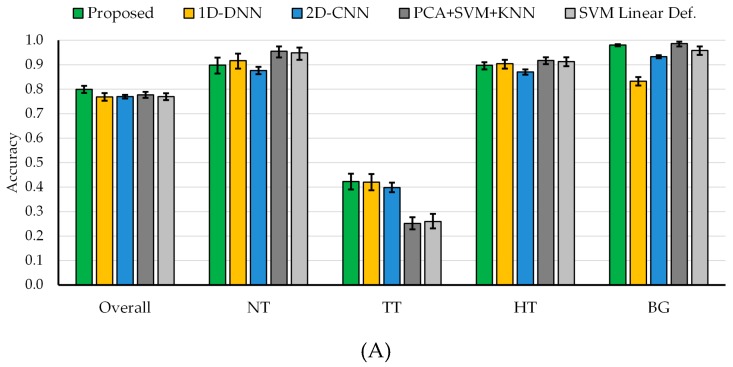
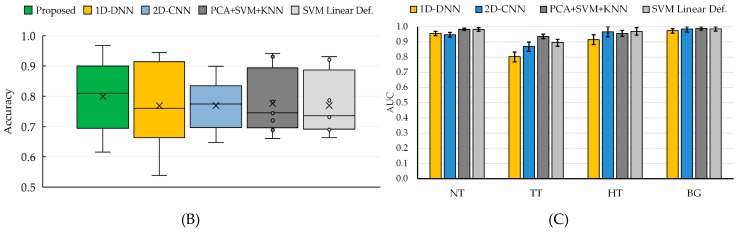
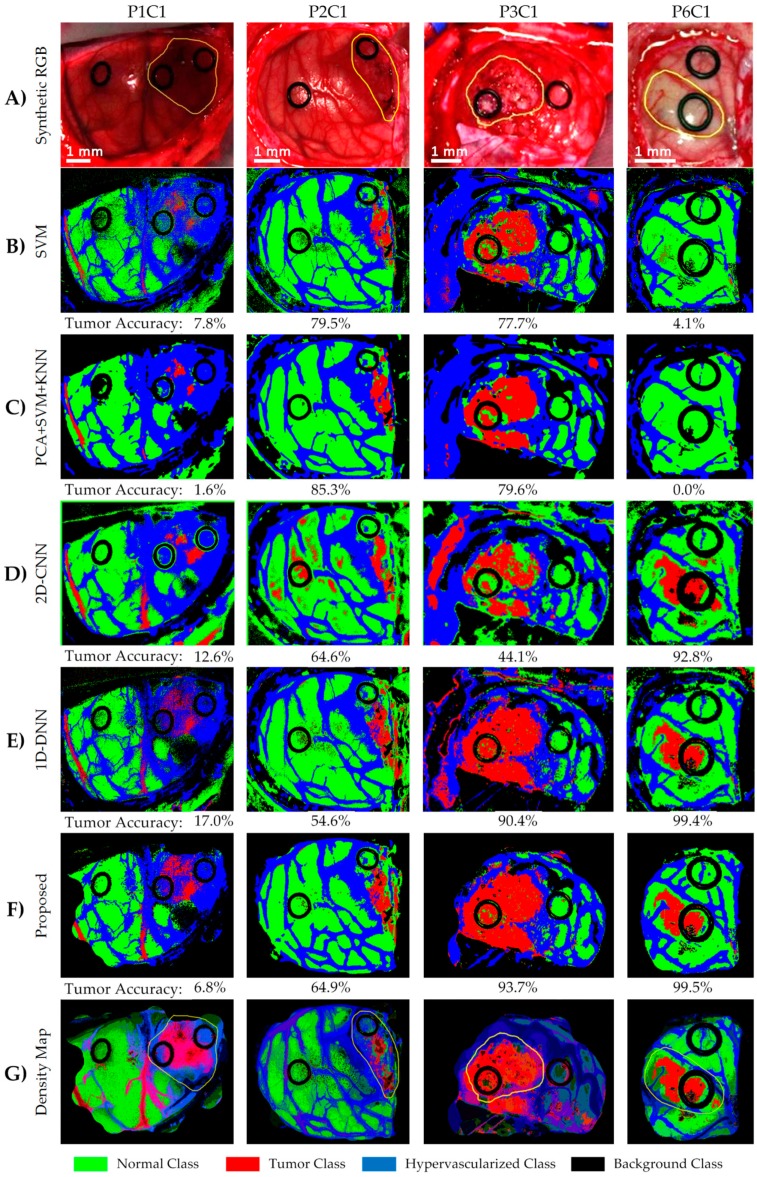
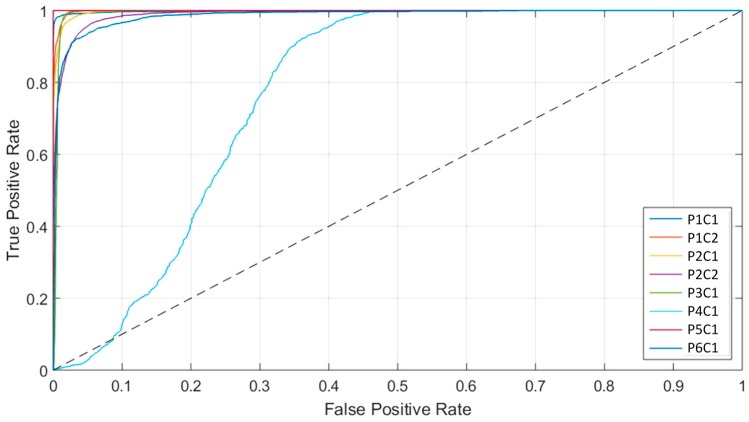
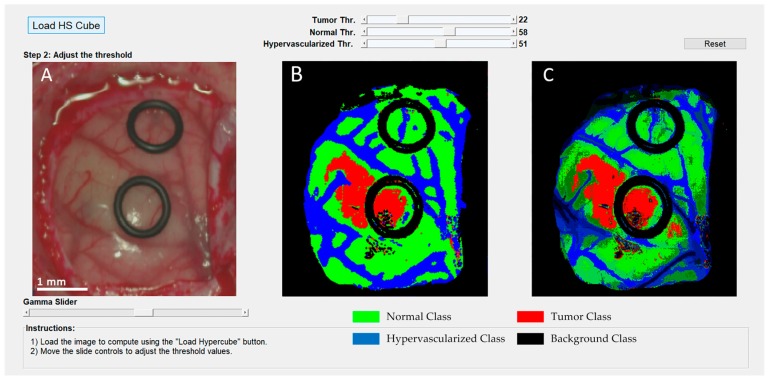
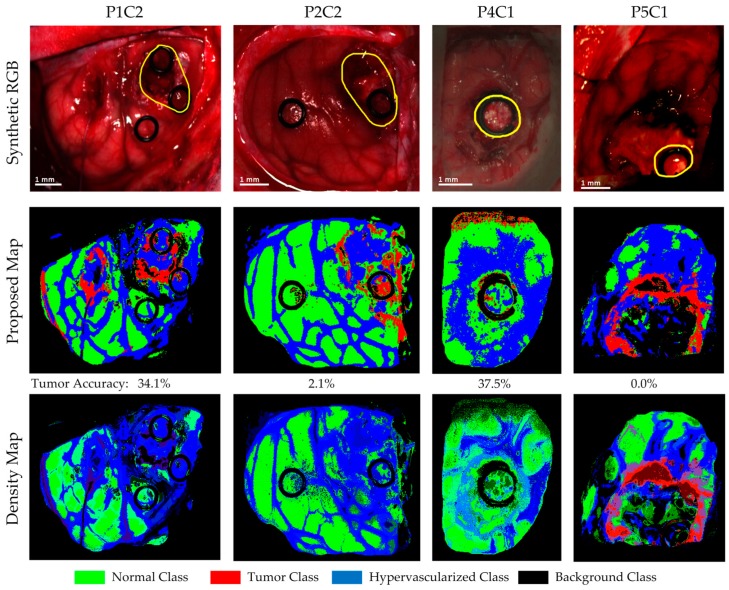
The main goal of brain cancer surgery is to perform an accurate resection of the tumor, preserving as much normal brain tissue as possible for the patient. The development of a non-contact and label-free method to provide reliable support for tumor resection in real-time during neurosurgical procedures is a current clinical need. Hyperspectral imaging is a non-contact, non-ionizing, and label-free imaging modality that can assist surgeons during this challenging task without using any contrast agent. In this work, we present a deep learning-based framework for processing hyperspectral images of in vivo human brain tissue. The proposed framework was evaluated by our human image database, which includes 26 in vivo hyperspectral cubes from 16 different patients, among which 258,810 pixels were labeled. The proposed framework is able to generate a thematic map where the parenchymal area of the brain is delineated and the location of the tumor is identified, providing guidance to the operating surgeon for a successful and precise tumor resection. The deep learning pipeline achieves an overall accuracy of 80% for multiclass classification, improving the results obtained with traditional support vector machine (SVM)-based approaches. In addition, an aid visualization system is presented, where the final thematic map can be adjusted by the operating surgeon to find the optimal classification threshold for the current situation during the surgical procedure.

Keywords: bioinformatics; brain tumor; cancer surgery; deep learning; hyperspectral imaging; image-guided surgery; intraoperative imaging; precision medicine.


Conflict of interest statement

The authors declare no conflict of interest. The founding sponsors had no role in the design of the study; in the collection, analyses, or interpretation of data; in the writing of the manuscript, and in the decision to publish the results.

Figures

Figure 1
Figure 1
(A) Intraoperative hyperspectral (HS) acquisition system capturing an image during a surgical procedure. (B) Synthetic red–green–blue (RGB) representation of an HS cube from an in vivo brain surface affected by glioblastoma (GBM) tumor (outlined in yellow). (C) Input and output spectral signatures of each step of the pre-processing chain employed to pre-process the HS cube. (D) Gold standard map obtained with the semi-automatic labeling tool from the HS cube. Normal, tumor, hypervascularized and background classes are represented in green, red, blue, and black color, respectively. White pixels correspond with non-labeled data. (E) Average and standard deviation of the spectral signatures of the tumor (red), normal (green), and blood vessel/hypervascularized (blue) labeled pixels.
Figure 2
Figure 2
Block diagram of the proposed deep learning framework. (A) Gray-scale representation employed as input for the deep learning parenchymal and blood vessel detection algorithms. (B) Blood vessel binary classification map. (C) Parenchymal binary classification map. (D) Four-class classification map obtained from the 1D-DNN algorithm. (E) Final four-class classification map generated by the proposed deep learning framework.
Figure 3
Figure 3
Gray-scale representation image examples and the correspondent three selected spectral channels employed in the three-band combination for the parenchymal and blood vessel detection. A synthetic RGB image is also included for comparison.
Figure 4
Figure 4
Block diagram of the spatial–spectral supervised algorithm pipeline.
Figure 5
Figure 5
Block diagram of the proposed surgical aid visualization algorithm to generate the three-class density map. A hierarchical K-means (HKM) algorithm and the proposed deep learning (DL) framework were used to generate the maps for the majority voting algorithm. (A) Four-class classification map generated by the proposed deep learning framework. (B) Unsupervised segmentation map generated by the Hierarchical K-Means algorithm. (C) Density map obtained by the Majority Voting algorithm. (D) Parenchymal binary classification map obtained in an internal step of the proposed DL framework. (E) Three-class density map generated by the proposed surgical aid visualization algorithm.
Figure 6
Figure 6
Average results of the leave-one-out cross-validation of the binary dataset obtained for each classification approach using the class-balancing and bootstrapping method with the 95% confidence interval.
Figure 7
Figure 7
Average results of the leave-one-out cross-validation of the four-class dataset obtained for each classification approach using the class-balancing and bootstrapping method with the 95% confidence interval. (A) Overall accuracy and accuracy per class results. (B) Boxplot of the overall accuracy results. (C) Area under the curve (AUC) results per class. [NT] Normal tissue; [TT] Tumor tissue; [HT] Hypervascularized tissue; [BG] Background.
Figure 7
Figure 7
Average results of the leave-one-out cross-validation of the four-class dataset obtained for each classification approach using the class-balancing and bootstrapping method with the 95% confidence interval. (A) Overall accuracy and accuracy per class results. (B) Boxplot of the overall accuracy results. (C) Area under the curve (AUC) results per class. [NT] Normal tissue; [TT] Tumor tissue; [HT] Hypervascularized tissue; [BG] Background.
Figure 8
Figure 8
Classification maps of four of the test hyperspectral (HS) images and their respective tumor accuracy below each map. (A) Synthetic RGB image with the tumor area surrounded by the yellow lines. (BF) Multiclass classification maps obtained with the support vector machine (SVM), principal component analysis (PCA) + SVM + K-nearest neighbors (KNN), 2D convolutional neural network (2D-CNN), one-dimensional 2D deep neural network (1D-DNN), and the proposed framework, respectively. Normal, tumor, and hypervascularized tissue are represented in green, red, and blue colors, respectively, while the background is represented in black. (G) Density maps generated using the surgical aid visualization algorithm with the optimal threshold established for the tumor class. In these maps, the colors have been adjusted depending on the probability values obtained after the majority voting algorithm.
Figure 9
Figure 9
Receiver operating characteristic (ROC) curves of the tumor class for each image of the test dataset generated from the one-dimensional deep neural network (1D-DNN) multiclass results.
Figure 10
Figure 10
Surgical aid visualization user interface with manual adjustable threshold values. (A) Synthetic RGB image generated from the hyperspectral imaging (HSI) cube. (B) 1D-DNN classification map generated with the established threshold. (C) Density map generated with the new classification map.
Figure 11
Figure 11
Classification maps of the four test HS images acquired after initial tumor resection and their respective tumor accuracy below each map. In these results, it is possible to observe the limitations of the current system when images are captured during the tumor resection procedure.
Figure 12
Figure 12
Class accuracy obtained with the proposed method for each test HS image. (*) Indicates the HS images acquired after beginning the resection. (¥) Indicates the image acquired with the tumor exposed in the surface, but under non-optimal illumination conditions.

References

    1. Siegel R.L., Miller K.D., Jemal A. Cancer statistics. CA Cancer J. Clin. 2016;66:7–30. doi: 10.3322/caac.21332. - DOI - PubMed
    1. Goodenberger M.L., Jenkins R.B. Genetics of adult glioma. Cancer Genet. 2012;205:613–621. doi: 10.1016/j.cancergen.2012.10.009. - DOI - PubMed
    1. Van Meir E.G., Hadjipanayis C.G., Norden A.D., Shu H.K., Wen P.Y., Olson J.J. Exciting New Advances in Neuro-Oncology: The Avenue to a Cure for Malignant Glioma. CA Cancer J. Clin. 2010;60:166–193. doi: 10.3322/caac.20069. - DOI - PMC - PubMed
    1. Sanai N., Polley M.-Y., McDermott M.W., Parsa A.T., Berger M.S. An extent of resection threshold for newly diagnosed glioblastomas. J. Neurosurg. 2011;115:3–8. doi: 10.3171/2011.2.JNS10998. - DOI - PubMed
    1. Sanai N., Berger M.S. Glioma extent of resection and its impact on patient outcome. Neurosurgery. 2008;62:753–764. doi: 10.1227/01.neu.0000318159.21731.cf. - DOI - PubMed

LinkOut - more resources