. 2019 Feb 22;11(2):257.
doi: 10.3390/cancers11020257.

The Role of Lactate Metabolism in Prostate Cancer Progression and Metastases Revealed by Dual-Agent Hyperpolarized 13C MRSI

Affiliations

The Role of Lactate Metabolism in Prostate Cancer Progression and Metastases Revealed by Dual-Agent Hyperpolarized 13C MRSI

Robert Bok et al. Cancers (Basel). .

Abstract

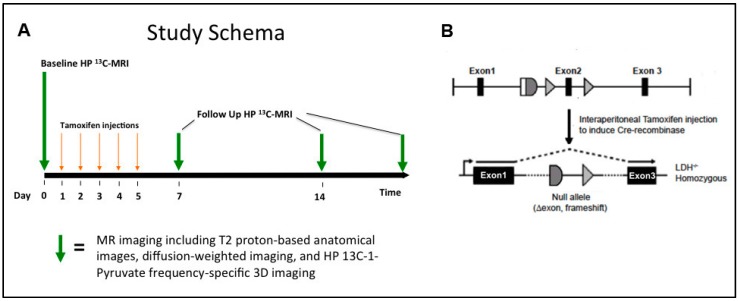
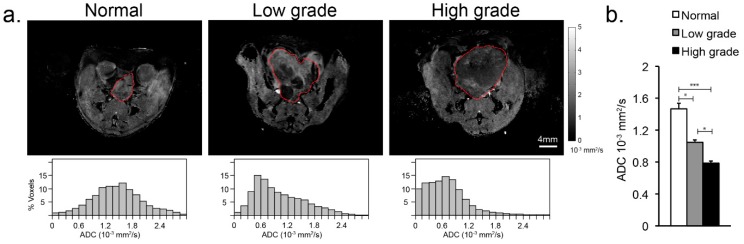
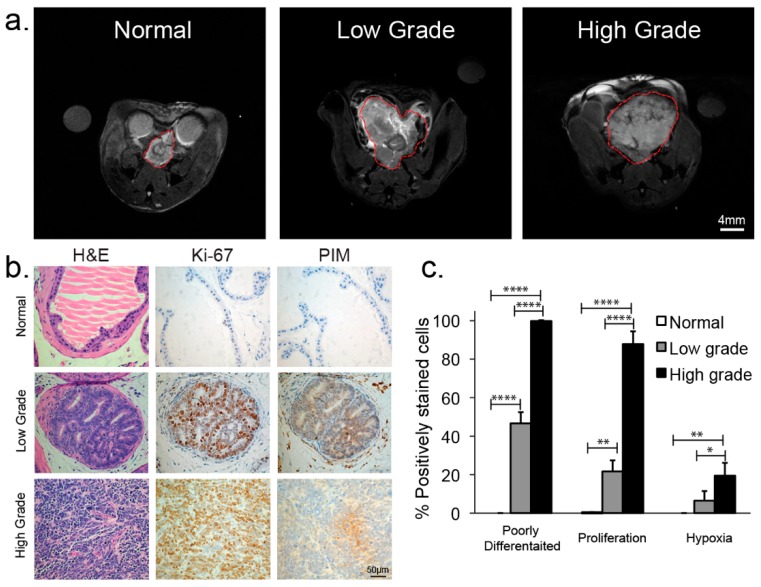
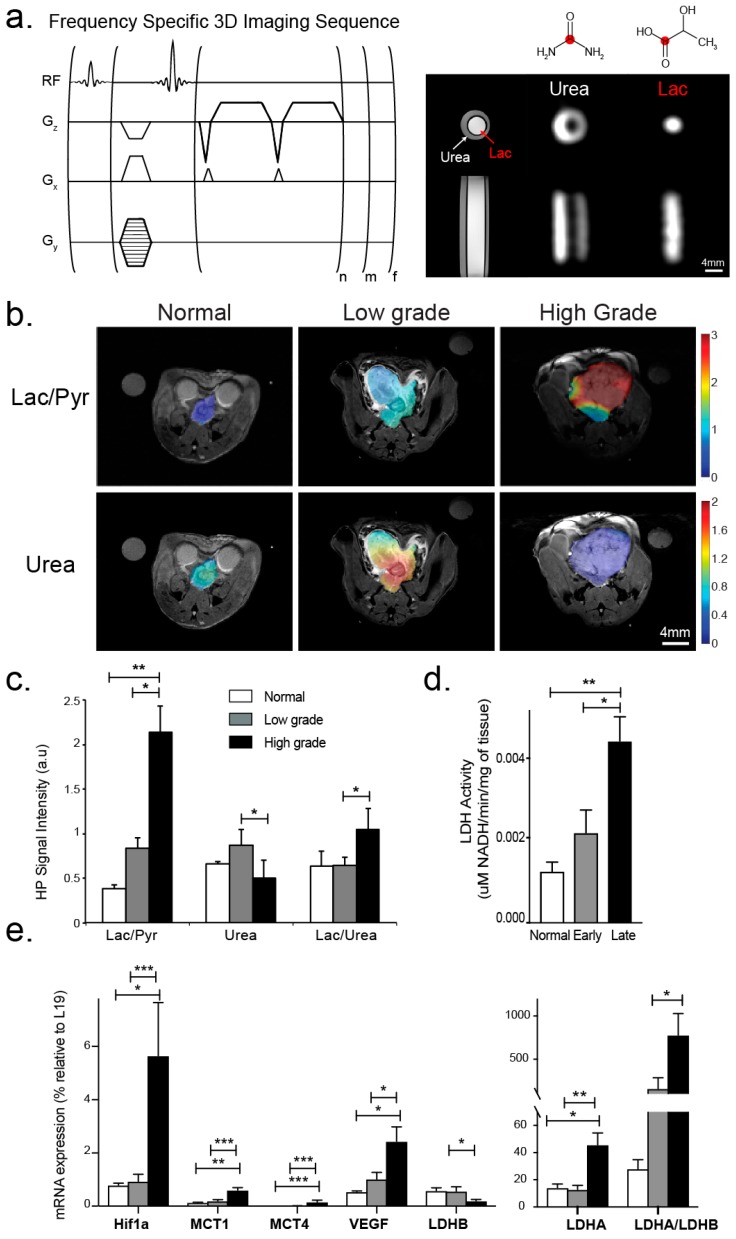
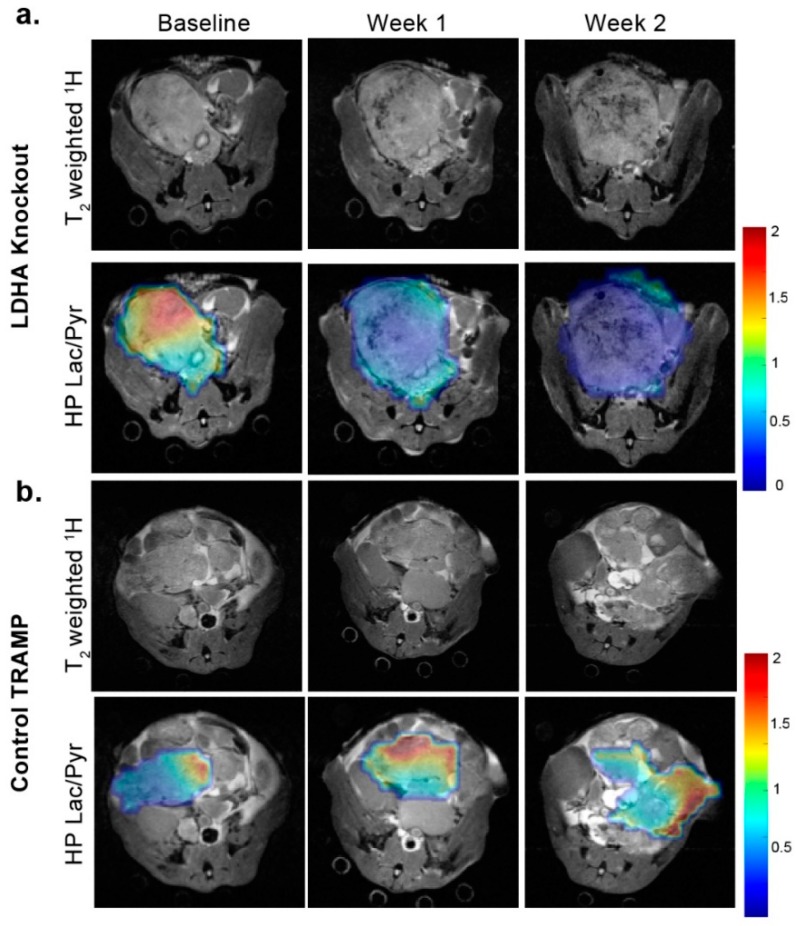
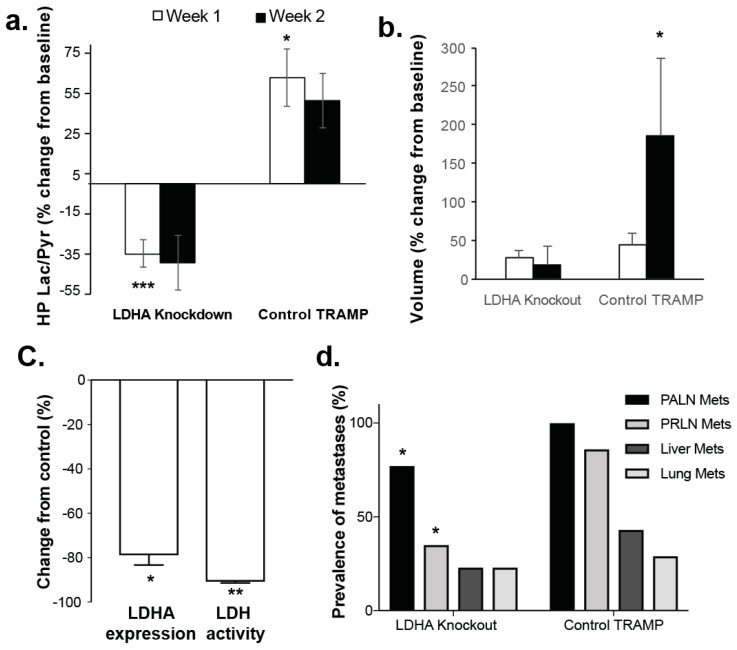
This study applied a dual-agent, 13C-pyruvate and 13C-urea, hyperpolarized 13C magnetic resonance spectroscopic imaging (MRSI) and multi-parametric (mp) ¹H magnetic resonance imaging (MRI) approach in the transgenic adenocarcinoma of mouse prostate (TRAMP) model to investigate changes in tumor perfusion and lactate metabolism during prostate cancer development, progression and metastases, and after lactate dehydrogenase-A (LDHA) knock-out. An increased Warburg effect, as measured by an elevated hyperpolarized (HP) Lactate/Pyruvate (Lac/Pyr) ratio, and associated Ldha expression and LDH activity were significantly higher in high- versus low-grade TRAMP tumors and normal prostates. The hypoxic tumor microenvironment in high-grade tumors, as measured by significantly decreased HP 13C-urea perfusion and increased PIM staining, played a key role in increasing lactate production through increased Hif1α and then Ldha expression. Increased lactate induced Mct4 expression and an acidic tumor microenvironment that provided a potential mechanism for the observed high rate of lymph node (86%) and liver (33%) metastases. The Ldha knockdown in the triple-transgenic mouse model of prostate cancer resulted in a significant reduction in HP Lac/Pyr, which preceded a reduction in tumor volume or apparent water diffusion coefficient (ADC). The Ldha gene knockdown significantly reduced primary tumor growth and reduced lymph node and visceral metastases. These data suggested a metabolic transformation from low- to high-grade prostate cancer including an increased Warburg effect, decreased perfusion, and increased metastatic potential. Moreover, these data suggested that LDH activity and lactate are required for tumor progression. The lactate metabolism changes during prostate cancer provided the motivation for applying hyperpolarized 13C MRSI to detect aggressive disease at diagnosis and predict early therapeutic response.

Keywords: hyperpolarized 13C; lactate; lactate dehydrogenase; magnetic resonance imaging; prostate cancer.


Conflict of interest statement

Kayvan Keshari is a consultant/advisory board member for Vision Imaging. The other authors declare no conflict of interest.

Figures

Figure 1
Figure 1
(A) Schematic of the study design for lactate dehydrogenase-A (LDHA) knockout studies. Multi-parametric 1H and HP 13C magnetic resonance imaging (MRI) exams performed pre- and post-LDHA knockdown. (B) Schematic of LDHA gene knockdown induced by tamoxifen administration.
Figure 2
Figure 2
(a) (top) Representative apparent water diffusion coefficient images (ADC, outlined in red) overlaid on corresponding T2-weighted anatomic images of the normal murine prostate, low- and high-grade prostate cancer. (a) (bottom) Plots of the distribution of water ADC values across the normal murine prostate and low- and high-grade TRAMP tumors. (b) Bar graph of the mean ± sdev ADC values for normal prostate, high- and low-grade cancer. * denotes p < 0.05, *** for p < 0.0005.
Figure 3
Figure 3
(a) Representative T2-weighted anatomic images of the normal murine prostate, low-grade and high-grade prostate cancer. (b) Immunochemical staining of excised representative normal murine prostate and low- and high-grade transgenic mouse model of prostate cancer (TRAMP) tumors; H&E section, Ki-67 staining, and Pimonidazole (PIM) staining (200× magnification). (c) Bar graph summarizing the mean ± sdev % positively poorly differentiated, Ki-67, and PIM stained cells of excised representative normal murine prostate and low- and high-grade TRAMP tumors. * denotes p < 0.05, ** for p < 0.005, **** for p < 0.0001.
Figure 4
Figure 4
(a) (top, left) Pulse sequence diagram of the high-spatial resolution 3D GRASE HP 13C MRSI imaging approach used for in vivo HP 13C imaging in this study (n and m number of phase encodes and f is the number of frequencies). (a) (top, right) Resonances of [1-13C] lactate, [1-13C] alanine [1-13C] pyruvate, and [13C] urea were excited and imaged sequentially as shown for the 13C lactate and 13C urea phantom. (b) Representative HP 13C Lac/Pyr and 13C-urea images overlaid on the corresponding T2-weighted anatomic images for the normal prostate, and low- and high-grade cancer. The color scale of the images represents the magnitude of the Lac/Pyr ratio. (c) Bar graph showing mean ± sdev values for Lac/Pyr, Urea/kidney Urea and Lac/Urea ratio from the normal mouse prostates and low and grade tumors studied. (d) Corresponding mean ± sdev LDH activity values. (e) Corresponding mean ± sdev mRNA expression values of key transporters and enzymes associated with pyruvate and lactate transport and metabolism (Mct1 and Mct4, Ldha and Ldhb) and of factors impacted by the hypoxic tumor microenvironment (Hif1α and Vegf). * denotes p < 0.05, ** for p < 0.005, *** for p < 0.0005.
Figure 5
Figure 5
Representative T2 weighted and overlaid HP Lac/Pyr images from an LDHA-TRAMP knockout mouse (a) and a vehicle control LDHA-TRAMP mouse (b), at baseline, 1-week and 2-weeks following the administration of tamoxifen (LDHA-knockout), or vehicle control (LDHA-intact). The color scale of the images represents the magnitude of the Lac/Pyr ratio. Scale bar: 0–2 relative Lac/Pyr ratio.
Figure 6
Figure 6
(a) Graphical presentation showing the mean ± sdev % changes in the HP Lac/Pyr from baseline of tamoxifen (LDHA-knockout), or vehicle control (LDHA-intact). (b) Corresponding mean ± sdev % volume changes from baseline. (c) Mean ± sdev % change from control of in Ldha expression and LDH activity in Ldha-knockout mice. (d)% prevalence of metastasis in control TRAMP to that in Ldha-knockout mice, concentrating on several typical sites of disease spread: regional lymph nodes (PALN), the more distant lymph nodes (PRLN), and visceral metastases (liver and lung). * denotes p < 0.05, ** for p < 0.005, *** for p < 0.0005.

References

    1. Siegel R.L., Miller K.D., Jemal A. Cancer statistics, 2018. CA Cancer J. Clin. 2018;68:7–30. doi: 10.3322/caac.21442. - DOI - PubMed
    1. Cooperberg M.R. Long-term active surveillance for prostate cancer: Answers and questions. J. Clin. Oncol. 2015;33:238–240. doi: 10.1200/JCO.2014.59.2329. - DOI - PubMed
    1. Cooperberg M.R., Carroll P.R. Trends in Management for Patients with Localized Prostate Cancer, 1990–2013. JAMA. 2015;314:80–82. doi: 10.1001/jama.2015.6036. - DOI - PubMed
    1. Gatenby R.A., Gillies R.J. Why do cancers have high aerobic glycolysis? Nat. Rev. Cancer. 2004;4:891–899. doi: 10.1038/nrc1478. - DOI - PubMed
    1. Koukourakis M.I., Giatromanolaki A., Panteliadou M., Pouliliou S.E., Chondrou P.S., Mavropoulou S., Sivridis E. Lactate dehydrogenase 5 isoenzyme overexpression defines resistance of prostate cancer to radiotherapy. Br. J. Cancer. 2014;110:2217–2223. doi: 10.1038/bjc.2014.158. - DOI - PMC - PubMed