. 2019 Feb 22;10(2):169.
doi: 10.3390/genes10020169.

The Effect of DNA Topology on Observed Rates of R-Loop Formation and DNA Strand Cleavage by CRISPR Cas12a

Affiliations

The Effect of DNA Topology on Observed Rates of R-Loop Formation and DNA Strand Cleavage by CRISPR Cas12a

Kara van Aelst et al. Genes (Basel). .

Abstract

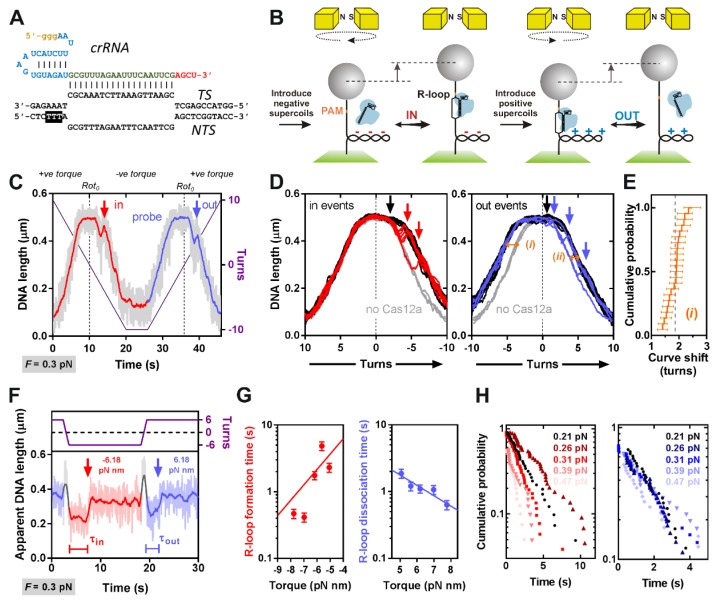
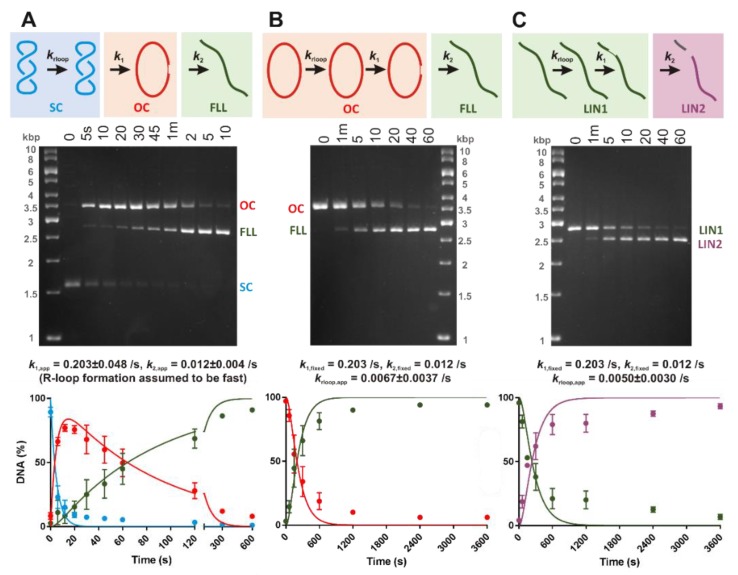
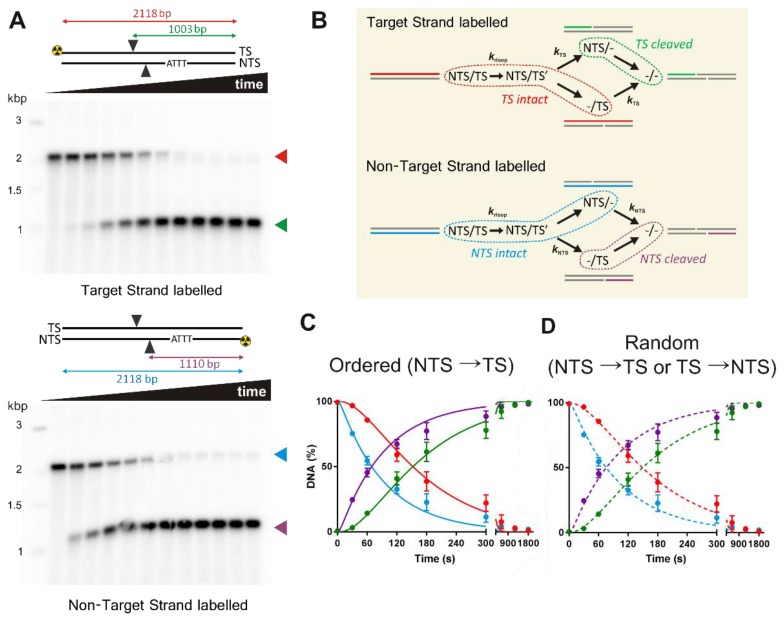
Here we explored the mechanism of R-loop formation and DNA cleavage by type V CRISPR Cas12a (formerly known as Cpf1). We first used a single-molecule magnetic tweezers (MT) assay to show that R-loop formation by Lachnospiraceae bacterium ND2006 Cas12a is significantly enhanced by negative DNA supercoiling, as observed previously with Streptococcus thermophilus DGCC7710 CRISPR3 Cas9. Consistent with the MT data, the apparent rate of cleavage of supercoiled plasmid DNA was observed to be >50-fold faster than the apparent rates for linear DNA or nicked circular DNA because of topology-dependent differences in R-loop formation kinetics. Taking the differences into account, the cleavage data for all substrates can be fitted with the same apparent rate constants for the two strand-cleavage steps, with the first event >15-fold faster than the second. By independently following the ensemble cleavage of the non-target strand (NTS) and target strand (TS), we could show that the faster rate is due to NTS cleavage, the slower rate due to TS cleavage, as expected from previous studies.

Keywords: DNA topology; endonuclease mechanism; rapid reaction kinetics.


Conflict of interest statement

The authors declare no conflicts of interest. The funders had no role in the design of the study; in the collection, analyses, or interpretation of data; in the writing of the manuscript, or in the decision to publish the results.

Figures

Figure 1
Figure 1
Domains and ternary structure of Lachnospiraceae bacterium ND2006 Cas12a (PDB: 5xus, TTTA PAM) [11]. Locations of “finger”, “linker” and “lid” from Stella et al. [8]; note that the “lid” is not resolved in PDB: 5xus. The putative path of the non-target strand (NTS) is shown on the structure as a thick dotted line, with the arrowhead pointing towards the RuvC active site.
Figure 2
Figure 2
Measurement of R-loop formation by LbCas12a using a magnetic tweezers assay. (A) DNA protospacer sequence (black) and CRISPR RNA (crRNA) showing the G-residues from in vitro transcription (brown), the pseudoknot (blue) and spacer (red). (B) Principle of the MT assay. See main text. (C) R-loop cycling experiment (1 turn s−1) in the presence of 5 nM Cas12a:crRNA. Raw DNA length taken at 60 Hz (grey). Data smoothed by a 1 Hz moving average (dark colors). DNA is negatively supercoiled at 0.3 pN (red) to induce R-loop formation (in), followed by positive supercoiling to probe R-loop formation (blue), resulting in R-loop dissociation (out). Rot0 are points where DNA turns are zero. (D) Overlay of R-loop cycles (N = 22) for negative supercoiling (in events) and positive supercoiling (out events). Cycles without Cas12a are in grey. Data was smoothed by a 1 Hz moving average. (i) and (ii) show rotation curve shifts due to captured R-loops. (E) Rotation curve shift due to R-loop events (i). Average = 1.87 ± 0.27 turns (errors = SD). (F) Examples of repetitive R-loop formation cycling (at 10 turns s−1) to measure R-loop formation times. Raw and 1 Hz smoothed data are shown. (G) Mean R-loop formation/dissociation times and standard error (N = 40 to 52) as a function of torque [29]. Solid lines are fits to Equation (1) (Table 1) [27]. (H) Inverted cumulative probability over time for R-loop formation (left) and dissociation (right) used to calculate mean times in panel F.
Figure 3
Figure 3
Apparent DNA cleavage rates are affected by substrate topology. Cleavage of 3 nM supercoiled (A), pre-nicked circular (B) and linear (C) substrates by 50 nM LbCas12a-crRNA. Diagrams represent the substrate, intermediate and product states: supercoiled (SC); nicked (open circle, OC); full length linear (FLL); linear substrate (LIN1); and products of linear DNA cleavage (LIN2). DNA species were separated by native agarose gel electrophoresis. (The OC and LIN1 data shown are from the same gel and thus share the same marker lane). The kinetic models were simultaneously fitted (solid lines) to each of three repeats and the rate constants averaged (Table 2, with SD errors). For panel A, krloop was fixed as infinitely fast. For panels (B) and (C), the k1 and k2 values were fixed using the fits in panel (A). Plotted points are the average of the 3 repeats, errors bars as SD.
Figure 4
Figure 4
LbCas12a cleaves the non-target strand faster than the target strand. (A) Linear DNA substrates were 32P-labelled on either the TS (upper panel) or NTS (lower panel). The PAM, approximate positions of NTS and TS cleavage, and sizes of the intact and cut labelled-strands are indicated. DNA species were separated by alkaline denaturing agarose gel electrophoresis. Each lane represents the reaction following LbCas12a addition (left to right): 0, 0.5, 1, 2, 3, 5, 10, 20, 30, 40, 50 and 60 min. (B) Diagrams showing overlap between substrate, intermediates and products depending on the labelled strand. Dotted lines enclose those species which will have the same labelled strand identity on a denaturing gel (C) Ordered kinetic model and (D) random kinetic model, simulated (solid and dashed lines, respectively) using values in Table 2. NTS and TS data points in both panels came from separate gels, as in panel (A), and are the average from 3 repeat experiments, with error bars as SD.

References

    1. Westra E.R., Swarts D.C., Staals R.H., Jore M.M., Brouns S.J., van der Oost J. The CRISPRs, they are a-changin’: How prokaryotes generate adaptive immunity. Annu. Rev. Genet. 2012;46:311–339. doi: 10.1146/annurev-genet-110711-155447. - DOI - PubMed
    1. Jiang F., Doudna J.A. CRISPR-Cas9 structures and mechanisms. Annu. Rev. Biophys. 2017;46:505–529. doi: 10.1146/annurev-biophys-062215-010822. - DOI - PubMed
    1. Mitsunobu H., Teramoto J., Nishida K., Kondo A. Beyond native Cas9: Manipulating genomic information and function. Trends Biotechnol. 2017;35:983–996. doi: 10.1016/j.tibtech.2017.06.004. - DOI - PubMed
    1. Zetsche B., Gootenberg J.S., Abudayyeh O.O., Slaymaker I.M., Makarova K.S., Essletzbichler P., Volz S.E., Joung J., van der Oost J., Regev A., et al. Cpf1 is a single RNA-guided endonuclease of a class 2 CRISPR-Cas system. Cell. 2015;163:759–771. doi: 10.1016/j.cell.2015.09.038. - DOI - PMC - PubMed
    1. Kleinstiver B.P., Tsai S.Q., Prew M.S., Nguyen N.T., Welch M.M., Lopez J.M., McCaw Z.R., Aryee M.J., Joung J.K. Genome-wide specificities of CRISPR-Cas Cpf1 nucleases in human cells. Nat. Biotechnol. 2016;34:869–874. doi: 10.1038/nbt.3620. - DOI - PMC - PubMed

Publication types

MeSH terms

LinkOut - more resources