

IPCT: Integrated Pharmacogenomic Platform of Human Cancer Cell Lines and Tissues
- PMID: 30813377
- PMCID: PMC6409836
- DOI: 10.3390/genes10020171
IPCT: Integrated Pharmacogenomic Platform of Human Cancer Cell Lines and Tissues
Abstract
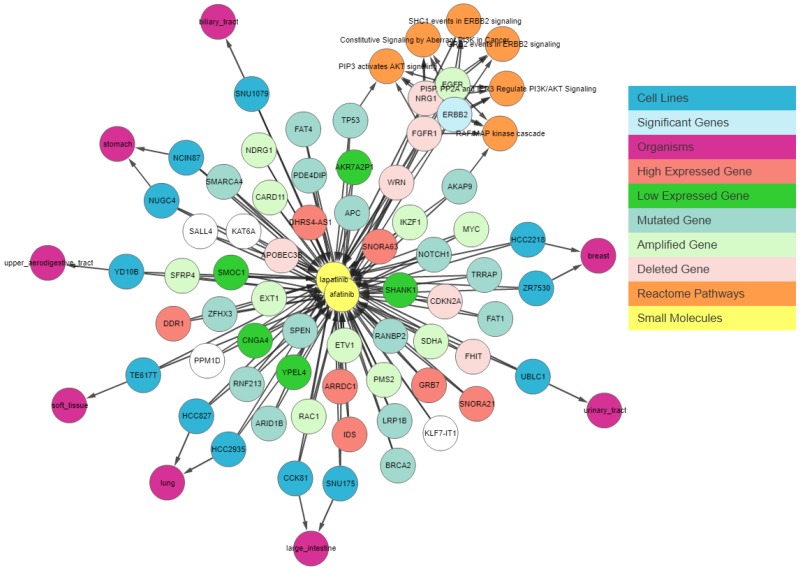
: (1) Motivation: The exponential increase in multilayered data, including omics, pathways, chemicals, and experimental models, requires innovative strategies to identify new linkages between drug response information and omics features. Despite the availability of databases such as the Cancer Cell Line Encyclopedia (CCLE), the Cancer Therapeutics Response Portal (CTRP), and The Cancer Genome Atlas (TCGA), it is still challenging for biologists to explore the relationship between drug response and underlying genomic features due to the heterogeneity of the data. In light of this, the Integrated Pharmacogenomic Database of Cancer Cell Lines and Tissues (IPCT) has been developed as a user-friendly way to identify new linkages between drug responses and genomic features, as these findings can lead not only to new biological discoveries but also to new clinical trials. (2) Results: The IPCT allows biologists to compare the genomic features of sensitive cell lines or small molecules with the genomic features of tumor tissues by integrating the CTRP and CCLE databases with the REACTOME, cBioPortal, and Expression Atlas databases. The input consists of a list of small molecules, cell lines, or genes, and the output is a graph containing data entities connected with the queried input. Users can apply filters to the databases, pathways, and genes as well as select computed sensitivity values and mutation frequency scores to generate a relevant graph. Different objects are differentiated based on the background color of the nodes. Moreover, when multiple small molecules, cell lines, or genes are input, users can see their shared connections to explore the data entities common between them. Finally, users can view the resulting graphs in the online interface or download them in multiple image or graph formats. (3) Availability and Implementation: The IPCT is available as a web application with an integrated MySQL database. The web application was developed using Java and deployed on the Tomcat server. The user interface was developed using HTML5, JQuery v.3.1.0 , and the Cytoscape Graph API v.1.0.4. The IPCT can be accessed at http://ipct.ewostech.net. The source code is available at https://github.com/muhammadshoaib/ipct.
Keywords: cell lines; database; drug sensitivity; genomics; pharmacogenomics.
Conflict of interest statement
The authors declare no conflict of interest
Figures


Similar articles
-
cMapper: gene-centric connectivity mapper for EBI-RDF platform.Bioinformatics. 2017 Jan 15;33(2):266-271. doi: 10.1093/bioinformatics/btw612. Epub 2016 Sep 25. Bioinformatics. 2017. PMID: 27667790
-
Integrating heterogeneous drug sensitivity data from cancer pharmacogenomic studies.Oncotarget. 2016 Aug 9;7(32):51619-51625. doi: 10.18632/oncotarget.10010. Oncotarget. 2016. PMID: 27322211 Free PMC article.
-
Predicting cancer drug response using parallel heterogeneous graph convolutional networks with neighborhood interactions.Bioinformatics. 2022 Sep 30;38(19):4546-4553. doi: 10.1093/bioinformatics/btac574. Bioinformatics. 2022. PMID: 35997568
-
Evaluating the consistency of large-scale pharmacogenomic studies.Brief Bioinform. 2019 Sep 27;20(5):1734-1753. doi: 10.1093/bib/bby046. Brief Bioinform. 2019. PMID: 31846027 Free PMC article. Review.
-
Using Pharmacogenomic Databases for Discovering Patient-Target Genes and Small Molecule Candidates to Cancer Therapy.Front Pharmacol. 2016 Sep 29;7:312. doi: 10.3389/fphar.2016.00312. eCollection 2016. Front Pharmacol. 2016. PMID: 27746730 Free PMC article. Review.
Cited by
-
PI3K/mTOR inhibitors promote G6PD autophagic degradation and exacerbate oxidative stress damage to radiosensitize small cell lung cancer.Cell Death Dis. 2023 Oct 6;14(10):652. doi: 10.1038/s41419-023-06171-7. Cell Death Dis. 2023. PMID: 37802999 Free PMC article.
-
An Introduction to Systems Analytics and Integration of Big Omics Data.Genes (Basel). 2020 Feb 26;11(3):245. doi: 10.3390/genes11030245. Genes (Basel). 2020. PMID: 32111000 Free PMC article.
References
-
- Barretina J., Caponigro G., Stransky N., Venkatesan K., Margolin A.A., Kim S., Wilson C.J., Lehár J., Kryukov G.V., Sonkin D., et al. The Cancer Cell Line Encyclopedia enables predictive modelling of anticancer drug sensitivity. Nature. 2012;483:603–607. doi: 10.1038/nature11003. - DOI - PMC - PubMed
Publication types
MeSH terms
LinkOut - more resources
Full Text Sources
Molecular Biology Databases
