

Intraintestinal Delivery of Tastants Using a Naso-Duodenal-Ileal Catheter Does Not Influence Food Intake or Satiety
- PMID: 30813412
- PMCID: PMC6412712
- DOI: 10.3390/nu11020472
Intraintestinal Delivery of Tastants Using a Naso-Duodenal-Ileal Catheter Does Not Influence Food Intake or Satiety
Abstract
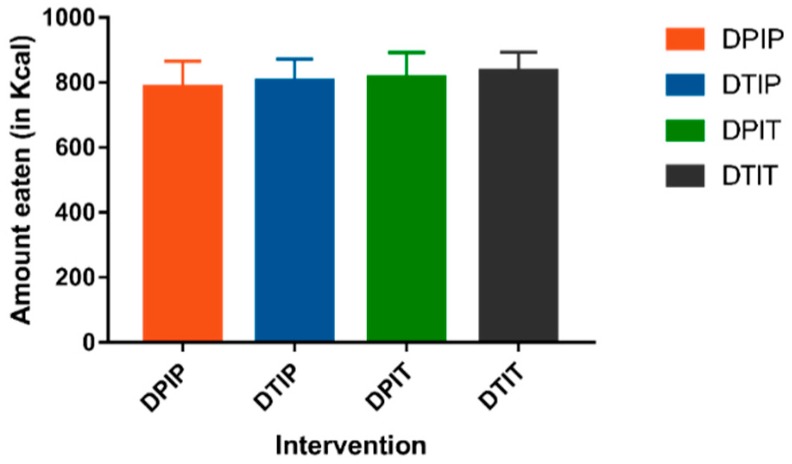
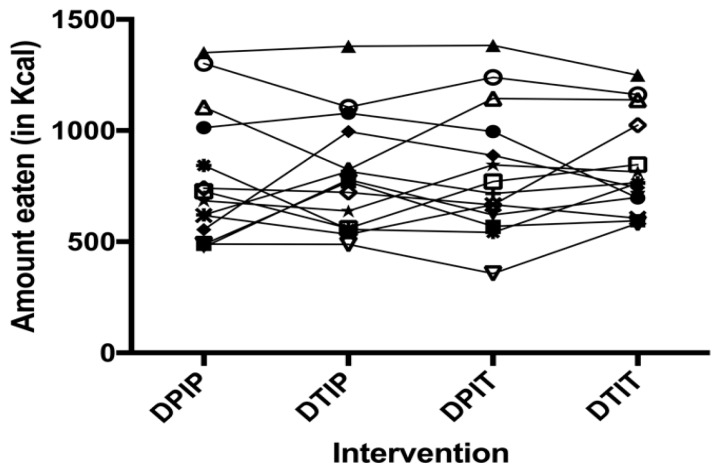
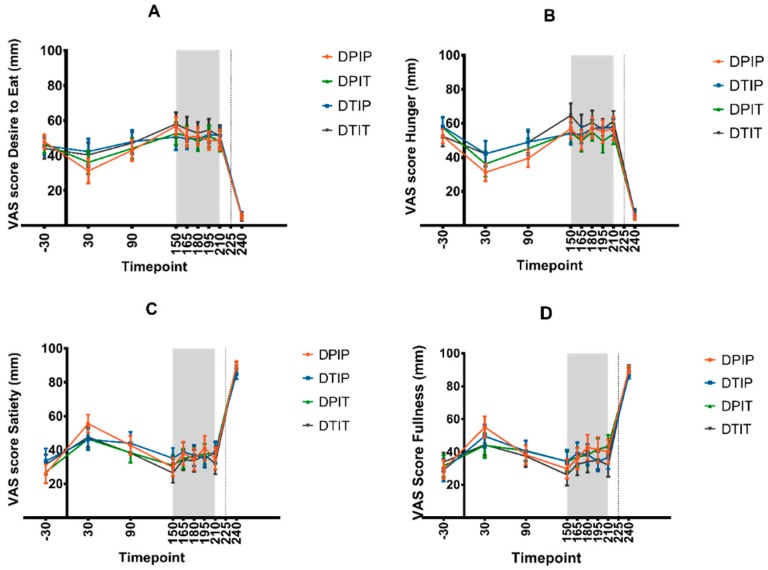
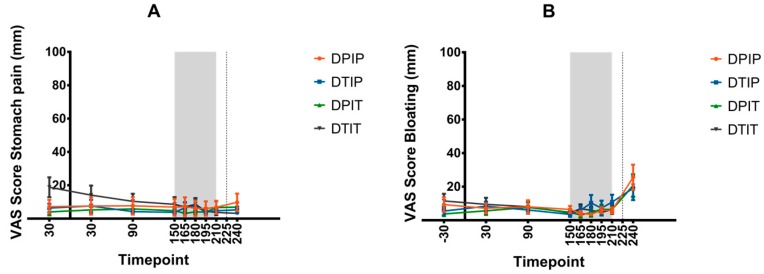
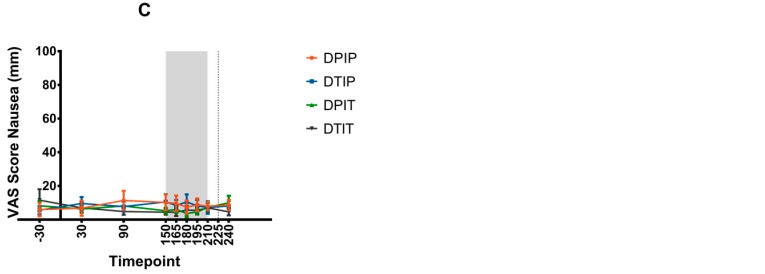
Intraduodenal activity of taste receptors reduces food intake. Taste receptors are expressed throughout the entire gastrointestinal tract. Currently, there are no data available on the effects of distal taste receptor activation. In this study, we investigate the effect of intraduodenal and/or intraileal activation of taste receptors on food intake and satiety. In a single-blind randomized crossover trial, fourteen participants were intubated with a naso-duodenal-ileal catheter and received four infusion regimens: duodenal placebo and ileal placebo (DPIP), duodenal tastants and ileal placebo (DTIP), duodenal placebo and ileal tastants (DPIT), duodenal tastants and ileal tastants (DTIT). Fifteen minutes after cessation of infusion, subjects received an ad libitum meal to measure food intake. Visual analog scale scores for satiety feelings were collected at regular intervals. No differences in food intake were observed between the various interventions (DPIP: 786.6 ± 79.2 Kcal, DTIP: 803.3 ± 69.0 Kcal, DPIT: 814.7 ± 77.3 Kcal, DTIT: 834.8 ± 59.2 Kcal, p = 0.59). No differences in satiety feelings were observed. Intestinal infusion of tastants using a naso-duodenal-ileal catheter did not influence food intake or satiety feelings. Possibly, the burden of the four-day naso-duodenal-ileal intubation masked a small effect that tastants might have on food intake and satiety.
Keywords: food intake; intraduodenal infusion; intraileal infusion; overweight; satiety; tastants; weight management.
Conflict of interest statement
The funders had no role in the design of the study; in the collection, analyses, or interpretation of data; in the writing of the manuscript or in the decision to publish the results. No specific grant was received for open access publication. T.K. received a salary from Will Pharma BV as part of the ‘Subsidie MKB Innovatiestimulering Topsectoren’ (MIT) for the period related to the execution of the present study. D.K. and A.A.M.M. have received an unrestricted grant from Will Pharma B.V. for execution of a study unrelated to the present study. A.M.E.A., M.v.A., F.J.T. reported no conflicts of interest.
Figures
Similar articles
-
Review on the Regional Effects of Gastrointestinal Luminal Stimulation on Appetite and Energy Intake: (Pre)clinical Observations.Nutrients. 2021 May 11;13(5):1601. doi: 10.3390/nu13051601. Nutrients. 2021. PMID: 34064724 Free PMC article. Review.
-
Intraduodenal infusion of a combination of tastants decreases food intake in humans.Am J Clin Nutr. 2015 Oct;102(4):729-35. doi: 10.3945/ajcn.115.113266. Epub 2015 Aug 19. Am J Clin Nutr. 2015. PMID: 26289437 Clinical Trial.
-
Small intestinal protein infusion in humans: evidence for a location-specific gradient in intestinal feedback on food intake and GI peptide release.Int J Obes (Lond). 2017 Feb;41(2):217-224. doi: 10.1038/ijo.2016.196. Epub 2016 Nov 4. Int J Obes (Lond). 2017. PMID: 27811949 Clinical Trial.
-
Effect of oral or intragastric delivery of the bitter tastant quinine on food intake and appetite sensations: a randomised crossover trial.Br J Nutr. 2021 Jan 14;125(1):92-100. doi: 10.1017/S0007114520002536. Epub 2020 Jul 14. Br J Nutr. 2021. PMID: 32660667 Clinical Trial.
-
Review article: The gastrointestinal tract: neuroendocrine regulation of satiety and food intake.Aliment Pharmacol Ther. 2007 Dec;26 Suppl 2:241-50. doi: 10.1111/j.1365-2036.2007.03550.x. Aliment Pharmacol Ther. 2007. PMID: 18081667 Review.
Cited by
-
Review on the Regional Effects of Gastrointestinal Luminal Stimulation on Appetite and Energy Intake: (Pre)clinical Observations.Nutrients. 2021 May 11;13(5):1601. doi: 10.3390/nu13051601. Nutrients. 2021. PMID: 34064724 Free PMC article. Review.
-
Taste, Nutrition, and Health.Nutrients. 2020 Jan 6;12(1):155. doi: 10.3390/nu12010155. Nutrients. 2020. PMID: 31935855 Free PMC article.
-
Development of a delayed-release nutrient for appetite control in adults with obesity and type 2 diabetes and initial clinical testing in a single dose randomized controlled trial.Nutr Diabetes. 2019 Jul 15;9(1):20. doi: 10.1038/s41387-019-0088-7. Nutr Diabetes. 2019. PMID: 31308360 Free PMC article. Clinical Trial.
-
Predictive value of adipose to muscle area ratio based on MRI at knee joint for postoperative functional outcomes in elderly osteoarthritis patients following total knee arthroplasty.J Orthop Surg Res. 2020 Oct 27;15(1):494. doi: 10.1186/s13018-020-02014-9. J Orthop Surg Res. 2020. PMID: 33109259 Free PMC article.
-
Effects of gastrointestinal delivery of non-caloric tastants on energy intake: a systematic review and meta-analysis.Eur J Nutr. 2021 Sep;60(6):2923-2947. doi: 10.1007/s00394-021-02485-4. Epub 2021 Feb 8. Eur J Nutr. 2021. PMID: 33559026 Free PMC article.
References
-
- WHO Obesity and Overweight 2018. [(accessed on 3 August 2018)]; Available online: http://www.who.int/en/news-room/fact-sheets/detail/obesity-and-overweight.
-
- Verdich C., Flint A., Gutzwiller J.P., Naslund E., Beglinger C., Hellstrom P.M., Long S.J., Morgan L.M., Holst J.J., Astrup A. A meta-analysis of the effect of glucagon-like peptide-1 (7-36) amide on ad libitum energy intake in humans. J. Clin. Endocrinol. Metab. 2001;86:4382–4389. doi: 10.1210/jc.86.9.4382. - DOI - PubMed
Publication types
MeSH terms
Substances
Grants and funding
LinkOut - more resources
Full Text Sources
Medical
