Meta-Analysis
. 2019 Feb 24;11(2):478.
doi: 10.3390/nu11020478.

Effect of Ramadan Fasting on Weight and Body Composition in Healthy Non-Athlete Adults: A Systematic Review and Meta-Analysis

Affiliations
Meta-Analysis

Effect of Ramadan Fasting on Weight and Body Composition in Healthy Non-Athlete Adults: A Systematic Review and Meta-Analysis

Hamish A Fernando et al. Nutrients. .

Abstract

Background: Ramadan involves one month of fasting from sunrise to sunset. In this meta-analysis, we aimed to determine the effect of Ramadan fasting on weight and body composition.

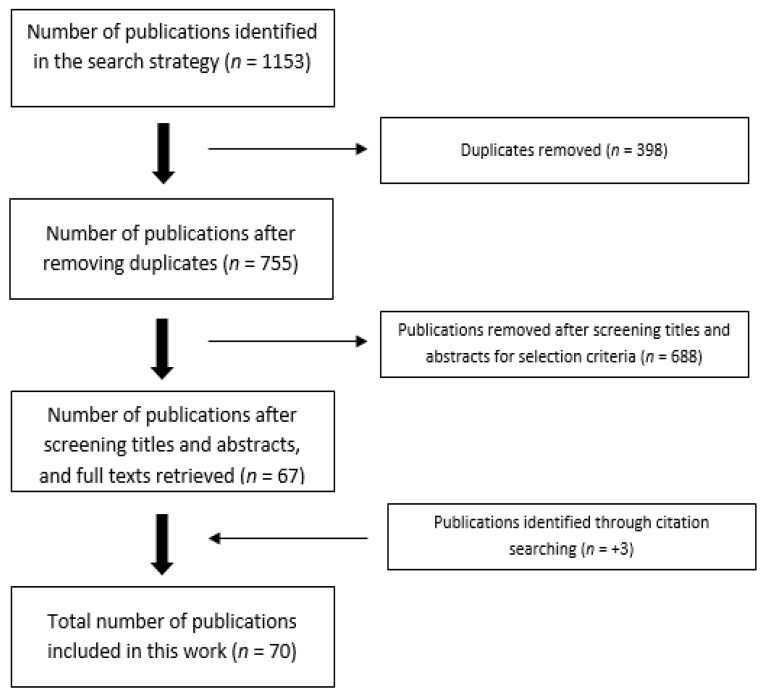
Methods: In May 2018, we searched six databases for publications that measured weight and body composition before and after Ramadan, and that did not attempt to influence physical activity or diet.

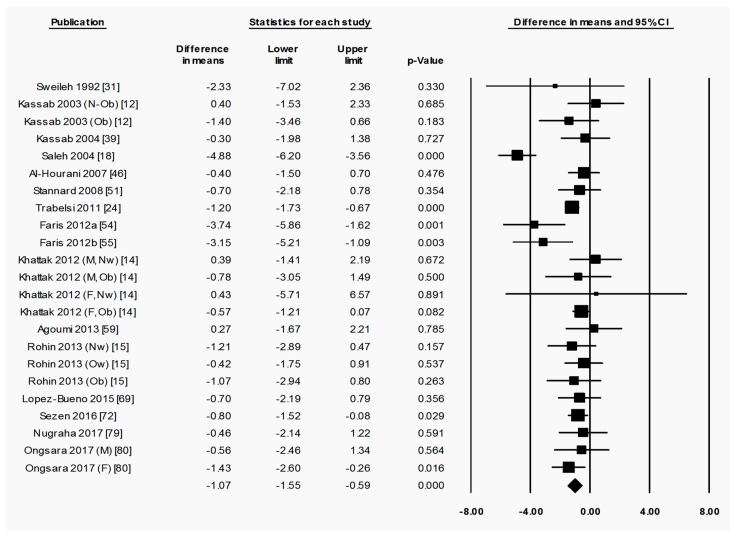
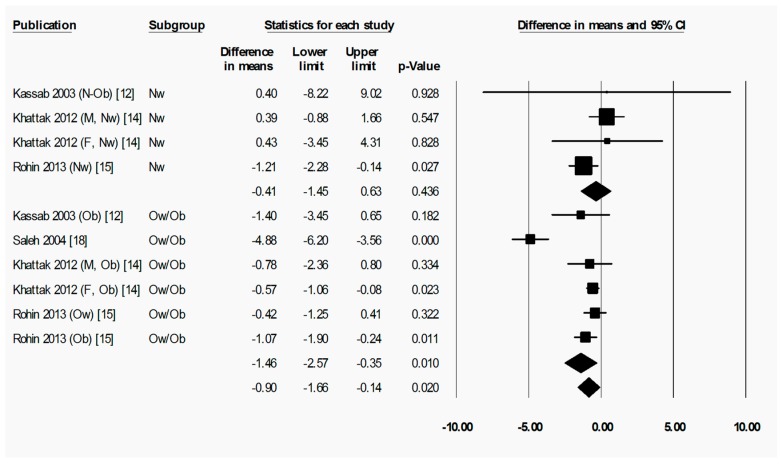
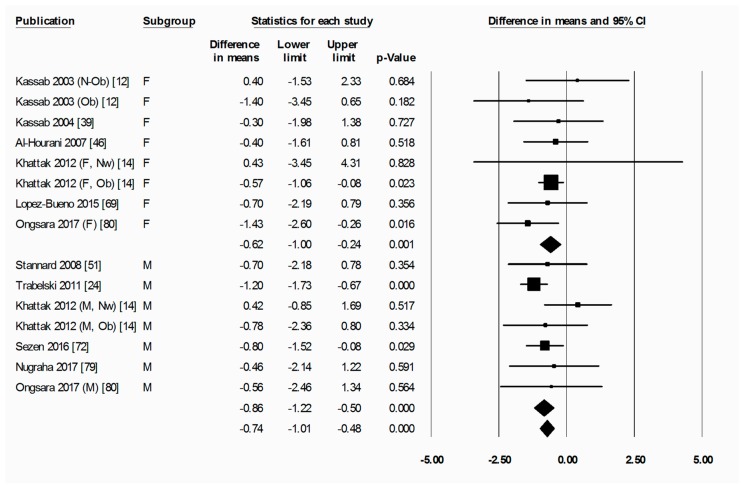
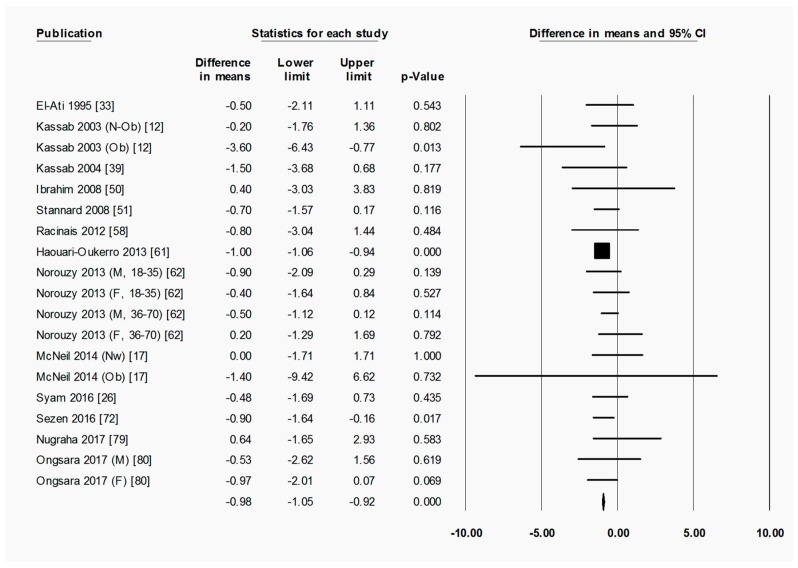
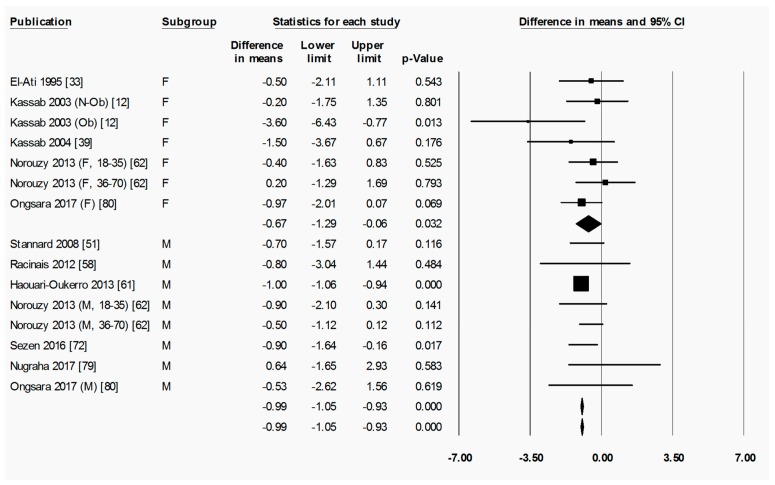
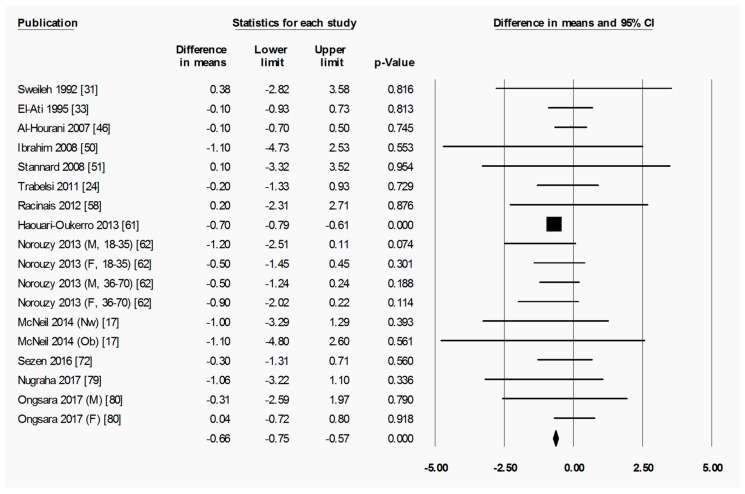
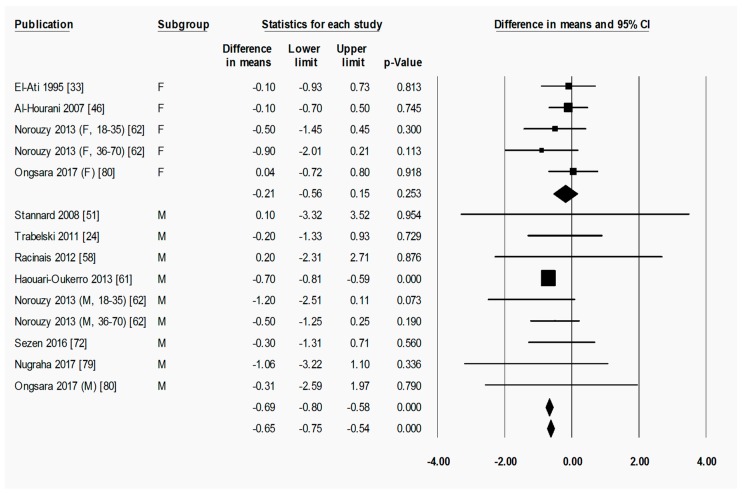
Results: Data were collected from 70 publications (90 comparison groups, 2947 participants). There was a significant positive correlation between starting body mass index and weight lost during the fasting period. Consistently, there was a significant reduction in fat percentage between pre-Ramadan and post-Ramadan in people with overweight or obesity (-1.46 (95% confidence interval: -2.57 to -0.35) %, p = 0.010), but not in those of normal weight (-0.41 (-1.45 to 0.63) %, p = 0.436). Loss of fat-free mass was also significant between pre-Ramadan and post-Ramadan, but was about 30% less than loss of absolute fat mass. At 2⁻5 weeks after the end of Ramadan, there was a return towards, or to, pre-Ramadan measurements in weight and body composition.

Conclusions: Even with no advice on lifestyle changes, there are consistent-albeit transient-reductions in weight and fat mass with the Ramadan fast, especially in people with overweight or obesity.

Keywords: Ramadan; body composition; body weight; intermittent fasting.


Conflict of interest statement

The funders had no role in the design of the study, in the collection, analyses, or interpretation of data, in the writing of the manuscript, or in the decision to publish the results. A.S. has received payment from Eli Lilly, the Pharmacy Guild of Australia, Novo Nordisk, the Dietitians Association of Australia, Shoalhaven Family Medical Centres and the Pharmaceutical Society of Australia for seminar presentation at conferences, and served on the Nestlé Health Science Optifast® VLCDTM Advisory Board from 2016-2018. She is also the author of The Don’t Go Hungry Diet (Bantam, Australia and New Zealand, 2007) and Don’t Go Hungry for Life (Bantam, Australia and New Zealand, 2011).

Figures

Figure 1
Figure 1
Flowchart for the selection of publications for systematic review and meta-analysis.
Figure 2
Figure 2
Fat percentage was significantly decreased by Ramadan fasting. Change in fat percentage (%) between pre-Ramadan (pre-R) and the end of Ramadan (post-R). Heterogeneity statistics: T = 0.829, p < 0.001, I2 = 61.5%. F = female; M = male; Nw = normal weight; Ow = overweight; Ob = obese; N-Ob = non-obese.
Figure 3
Figure 3
Fat percentage was significantly decreased by Ramadan fasting in the overweight/obese but not in the normal weight subgroup. Change in fat percentage (%) as subdivided by BMI category (normal weight and overweight/obese), between pre-Ramadan (pre-R) and the end of Ramadan (post-R). There was no significant difference between normal weight and overweight/obese subgroups (p = 0.178). Heterogeneity statistics: normal weight T = 0.508, p = 0.280, I2 = 21.7%; overweight/obese T = 1.536, p < 0.001, I2 = 86.8%. F = female; M = male; Nw = normal weight; Ow = overweight; Ob = obese; N-Ob = non-obese.
Figure 4
Figure 4
Fat percentage was significantly decreased by Ramadan fasting in both the female and the male subgroup. Change in fat percentage (%) as subdivided by sex (female and male), between pre-Ramadan (pre-R) and the end of Ramadan (post-R). There was no significant difference between female and male subgroups (p = 0.375). Heterogeneity statistics: female T = 0.000, p = 0.771, I2 = 0.0%; male T = 0.000, p = 0.435, I2 = 0.0%. F = female; M = male; Nw = normal weight; Ob = obese; N-Ob = non-obese.
Figure 5
Figure 5
Absolute fat mass was significantly decreased by Ramadan fasting. Change in absolute fat mass (kg) between pre-Ramadan (pre-R) and the end of Ramadan (post-R). Heterogeneity statistics: T = 0.000, p = 0.600, I2 = 0.0%. F = female; M = male; Nw = normal weight; Ob = obese; N-Ob = non-obese; 18–35, 36–70 = age range.
Figure 6
Figure 6
Absolute fat mass was significantly decreased by Ramadan fasting in both the female and the male subgroup. Change in absolute fat mass (kg) as subdivided by sex (female and male), between pre-Ramadan (pre-R) and the end of Ramadan (post-R). There was no significant difference between female and male subgroups (p = 0.314). Heterogeneity statistics: female T = 0.298, p = 0.333, I2 = 12.7%; male T = 0.000, p = 0.635, I2 = 0.0%. F = female; M = male; Ob = obese; N-Ob = non-obese; 18–35, 36–70 = age range.
Figure 7
Figure 7
Fat-free mass was significantly decreased by Ramadan fasting. Change in fat-free mass (kg) between pre-Ramadan (pre-R) and the end of Ramadan (post-R). Heterogeneity statistics: T = 0.000, p = 0.753, I2 = 0.0%. F = female; M = male; Nw = normal weight; Ob = obese; 18–35, 36–70 = age range.
Figure 8
Figure 8
Fat-free mass was significantly decreased by Ramadan fasting in the male but not in the female subgroup. Change in fat-free mass (kg) as subdivided by sex (female and male), between pre-Ramadan (pre-R) and the end of Ramadan (post-R). There was no significant difference between female and male subgroups (p = 0.360). Heterogeneity statistics: female T = 0.360, p = 0.653, I2 = 0.0%; male T = 0.000, p = 0.948, I2 = 0.0%. F = female; M = male; 18–35, 36–70 = age range.

References

    1. Kettani H. World Muslim Population: 1950–2020. Int. J. Environ. Sci. Technol. 2010;1:154–164.
    1. Sakr A.H. Fasting in Islam. J. Am. Diet. Assoc. 1975;67:17–21. - PubMed
    1. Trepanawski J.F., Bloomer R.J. The impact of religious fasting on human health. Nutr. J. 2010;9:57. doi: 10.1186/1475-2891-9-57. - DOI - PMC - PubMed
    1. Azizi F. Islamic Fasting and Health. Ann. Nutr. Metab. 2010;56:273–282. doi: 10.1159/000295848. - DOI - PubMed
    1. Sadeghirad B., Motaghipisheh S., Kolahdooz F., Zahedi M.J. Islamic fasting and weight loss: A systematic review and meta-analysis. Public Health Nutr. 2014;17:396–406. doi: 10.1017/S1368980012005046. - DOI - PMC - PubMed