. 2019 Apr 25;133(17):1888-1898.
doi: 10.1182/blood-2018-10-879585. Epub 2019 Feb 27.

A gene-based recessive diplotype exome scan discovers FGF6, a novel hepcidin-regulating iron-metabolism gene

Affiliations

A gene-based recessive diplotype exome scan discovers FGF6, a novel hepcidin-regulating iron-metabolism gene

Shicheng Guo et al. Blood. .

Abstract

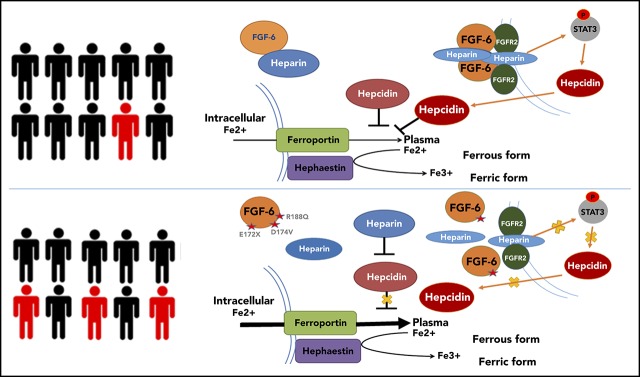
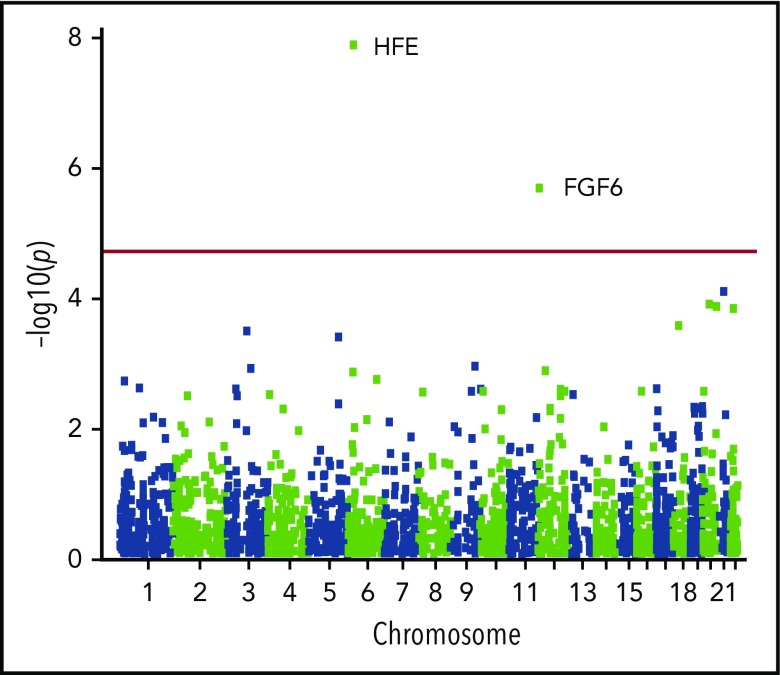
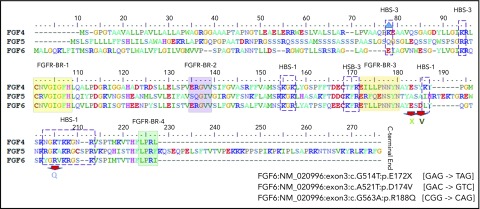
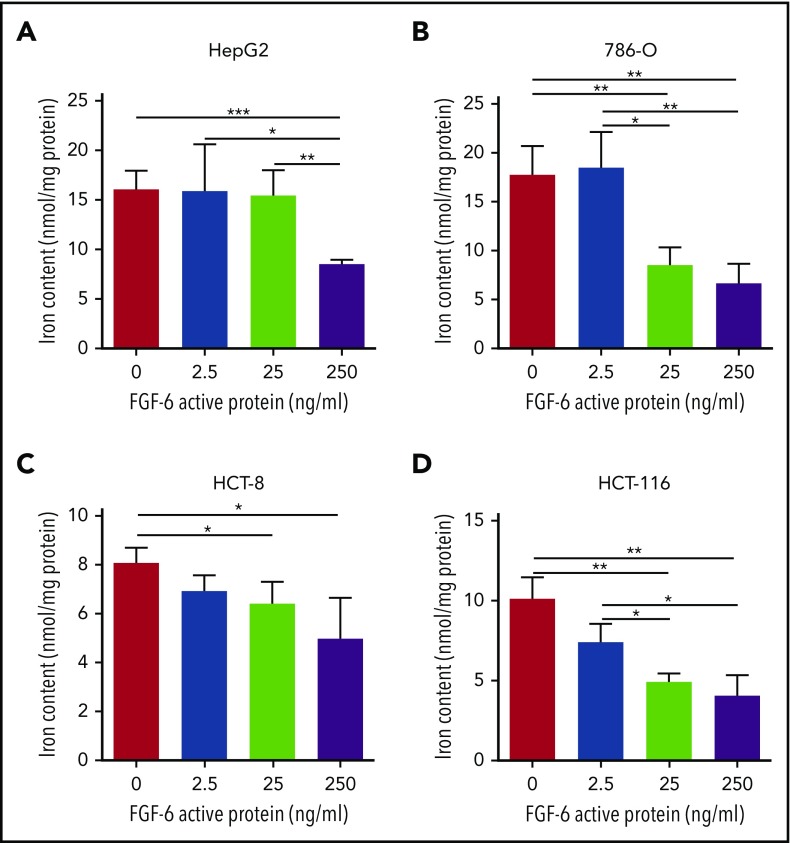
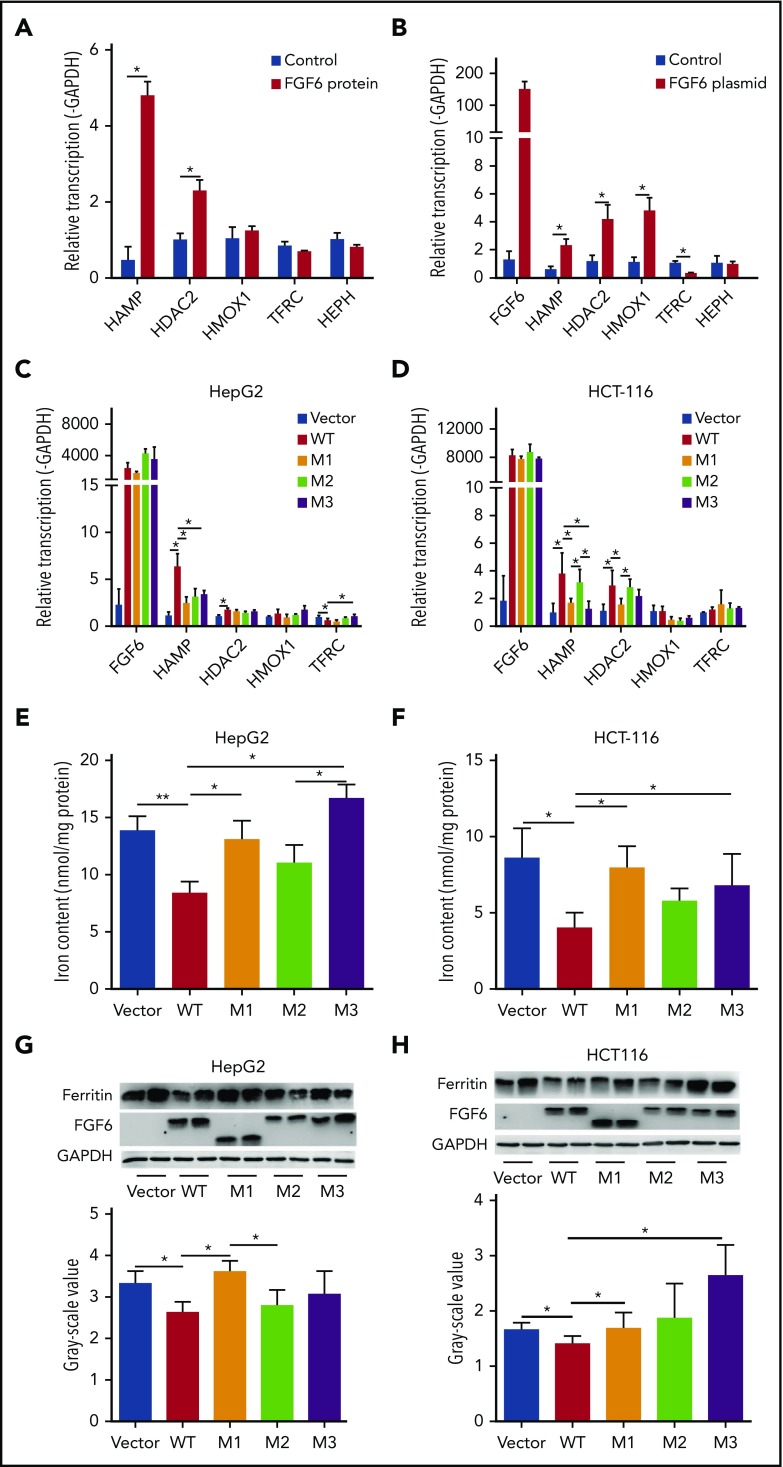
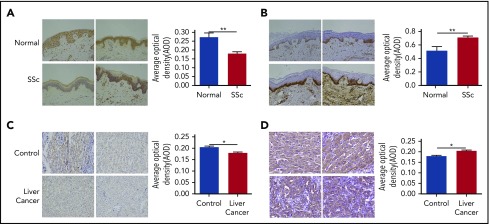
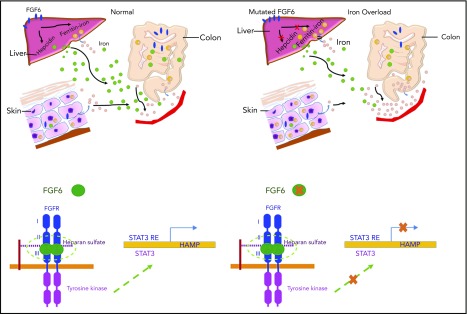
Standard analyses applied to genome-wide association data are well designed to detect additive effects of moderate strength. However, the power for standard genome-wide association study (GWAS) analyses to identify effects from recessive diplotypes is not typically high. We proposed and conducted a gene-based compound heterozygosity test to reveal additional genes underlying complex diseases. With this approach applied to iron overload, a strong association signal was identified between the fibroblast growth factor-encoding gene, FGF6, and hemochromatosis in the central Wisconsin population. Functional validation showed that fibroblast growth factor 6 protein (FGF-6) regulates iron homeostasis and induces transcriptional regulation of hepcidin. Moreover, specific identified FGF6 variants differentially impact iron metabolism. In addition, FGF6 downregulation correlated with iron-metabolism dysfunction in systemic sclerosis and cancer cells. Using the recessive diplotype approach revealed a novel susceptibility hemochromatosis gene and has extended our understanding of the mechanisms involved in iron metabolism.


Conflict of interest statement

Conflict-of-interest disclosure: The authors declare no competing financial interests.

Figures

None
Graphical abstract
Figure 1.
Figure 1.
Manhattan plot of the gene-based recessive diplotype association results. The association P-value testing hemochromatosis association for each gene (−log10 p plotted on the ordinate) on different chromosomes is shown in alternating navy blue and yellow along the abscissa, with the experiment-wise significance level for the gene-based analyses across the exome (experiment-wise α = 3.14 × 10⁻⁶) depicted in red.
Figure 2.
Figure 2.
Protein sequence alignment for FGF-4, FGF-5, and FGF-6 with heparin and FGFR-binding domains. Protein domains summarized from a previous FGF-6 functional study. Alignment and heparin and FGFR-binding sites/regions (HBS and FGFR-BR, respectively) are shown for FGF-4, FGF-5, and FGF-6 proteins.
Figure 3.
Figure 3.
FGF-6 active protein dosage effect on intracellular iron concentration. A ferrozine assay was applied for the evaluation of total cell iron content in HepG2 (human liver hepatocellular carcinoma cell line), 786-O (human kidney adenocarcinoma cell line), HCT-8 (human ileocecal colorectal adenocarcinoma cell line), HCT116 (human colon carcinoma cell line), and HFF-1 (human skin fibroblast cell line) with 10 μM FAC and 500 μM ascorbate in cell culture media, respectively, with different concentrations of FGF-6 active protein (0 ng/mL, 2.5 ng/mL, 25 ng/mL, and 250 ng/mL). Control group was treated with ascorbate alone. After 48-hour incubation, cells were lysed and iron contents were determined with the ferrozine assay. (A) Total iron content in HepG2 cells with increasing FGF-6 protein concentration. (B) Total iron content in 786-O cells with increasing FGF-6 protein concentration. (C) Total iron content in HCT-8 cells with increasing FGF-6 protein concentration. (D) Total iron content in HCT-116 cells with increasing FGF-6 protein concentration. *P < .05, **P < .01, ***P < .001.
Figure 4.
Figure 4.
The effect of FGF6 nonsynonymous variants on hepcidin expression and intracellular iron concentration. (A) The effect of FGF-6 active protein treatment on mRNA expression of several iron metabolism genes in HepG2 liver hepatocellular carcinoma cell culture media compared with control. Protein concentration was 250 ng/mL and the incubation time was 24 hours with 10 μM FAC and 500 μM ascorbate in the cell culture media. HAMP encodes for hepcidin. HDAC2 encodes for histone deacetylase 2. HMOX1 encodes for heme oxygenase 1. TFRC encodes for transferrin receptor 1 and HEPH encodes hephaestin. mRNA expression was quantified relative to GAPDH expression. Treatment with PBS served as control. A Student t test was used test for pairwise differences between sets of observations. *P < .05. Results are the mean ± standard deviation (SD) of 3 observations in a single experiment. (B) Iron-metabolism gene expression changes with FGF6 mRNA transfection in the HepG2 cell culture media after 24 hours. Vector without FGF6 served as control. A Student t test was used to test for pairwise differences between sets of observations. *P < .05. Results are the mean ± SD of 3 observations in a single experiment. (C-D) Iron-metabolism gene-expression changes after the transfection by FGF6 mRNA into various cell types with WT and the identified variants E172X (M1), D174V (M2), and R188Q (M3). Cell lines: HepG2 are liver hepatocellular carcinoma cells, HCT116 are ileocecal colorectal adenocarcinoma cells, and HFF-1 are human normal skin fibroblasts. A Student t test was used to test for pairwise differences between sets of observations. *P < .05. Results are the mean ± SD of 3 observations in a single experiment. (E-F) Total intracellular iron-concentration changes after the transfection with FGF6 mRNA into 3 cell types with WT and the identified M1, M2, and M3 variants in the presence of FAC for 48 hours. A Student t test was used to test for pairwise differences between sets of observations. *P < .05; **P < .01. Results are the mean ± SD of 3 observations in a single experiment. (G-H) Ferritin protein level changes after the transfection by FGF6 mRNA into the 3 cell types with WT and the identified M1, M2, and M3 variants in the presence of FAC for 48 hours. A Student t test was used to test for pairwise differences between sets of observations. *P < .05. Results are the mean ± SD of 3 observations in a single experiment.
Figure 5.
Figure 5.
Perls stain and ferritin expression. (A) FGF-6 protein level was evaluated by IHC assay (IHC) in skin tissues from SSc patients and healthy controls (Normal). Staining was visualized by Nikon microscopy; original magnification ×200. A Student t test was used to test for pairwise differences between AOD values between SSc and normal observations. The ratio of positive stain areas to the total area was used to evaluate protein levels. AODs were quantified by ImageJ software. **P < .01. (B) IHC with Perls Prussian Blue stain for ferritin protein was applied to evaluate the iron deposition in SSc skin tissues and healthy skin tissue. AOD values were quantified by ImageJ software. Staining was visualized by Nikon microscopy; original magnification ×200. **P < .01. (C) IHC of FGF-6 protein in liver cancer tissue and control tissue. AODs were quantified by ImageJ software. Staining was visualized by Nikon microscopy; original magnification ×200. *P < .05. (D) IHC of ferritin protein using Perls Prussian Blue stain in liver cancer tissue and control tissue. AODs were quantified by ImageJ software. Staining was visualized by Nikon microscopy; original magnification ×200. *P < .05.
Figure 6.
Figure 6.
The proposed mechanism of FGF-6 in the regulation of hepcidin expression and iron concentrations. Paracrine FGF-6 interacts with FGFR with heparin or heparin sulfate proteoglycan (HPSG) as the cofactor to initial FGF pathway. Activated FGFRs have the ability to phosphorylate specific tyrosine residues and activate STAT3 pathway. Iron overload and inflammation could positively regulate hepcidin by BMP/Smad pathway and inflammatory IL-6/STAT3 pathways., However, loss-of-function FGF6 variants will silence the FGF6-FGFR pathway, increase free heparin, and reduce expression of hepcidin, thereby decreasing the inhibition of ferroportin-mediated iron transfer from the intracellular compartment to the blood (ie, increasing plasma levels of iron). In SSc patients, IL-6 is increased so that hepcidin will be positively regulated which suppresses iron release to the plasma generating higher iron levels in skin cells.

References

    1. Lek M, Karczewski KJ, Minikel EV, et al. ; Exome Aggregation Consortium. Analysis of protein-coding genetic variation in 60,706 humans. Nature. 2016;536(7616):285-291. - PMC - PubMed
    1. MacArthur DG, Balasubramanian S, Frankish A, et al. ; 1000 Genomes Project Consortium. A systematic survey of loss-of-function variants in human protein-coding genes. Science. 2012;335(6070):823-828. - PMC - PubMed
    1. Zou J, Valiant G, Valiant P, et al. . Quantifying unobserved protein-coding variants in human populations provides a roadmap for large-scale sequencing projects. Nat Commun. 2016;7(1):13293. - PMC - PubMed
    1. Cohen JC, Kiss RS, Pertsemlidis A, Marcel YL, McPherson R, Hobbs HH. Multiple rare alleles contribute to low plasma levels of HDL cholesterol. Science. 2004;305(5685):869-872. - PubMed
    1. Andreoletti G, Shakhnovich V, Christenson K, et al. . Exome analysis of rare and common variants within the NOD signaling pathway. Sci Rep. 2017;7(1):46454. - PMC - PubMed

Publication types

MeSH terms